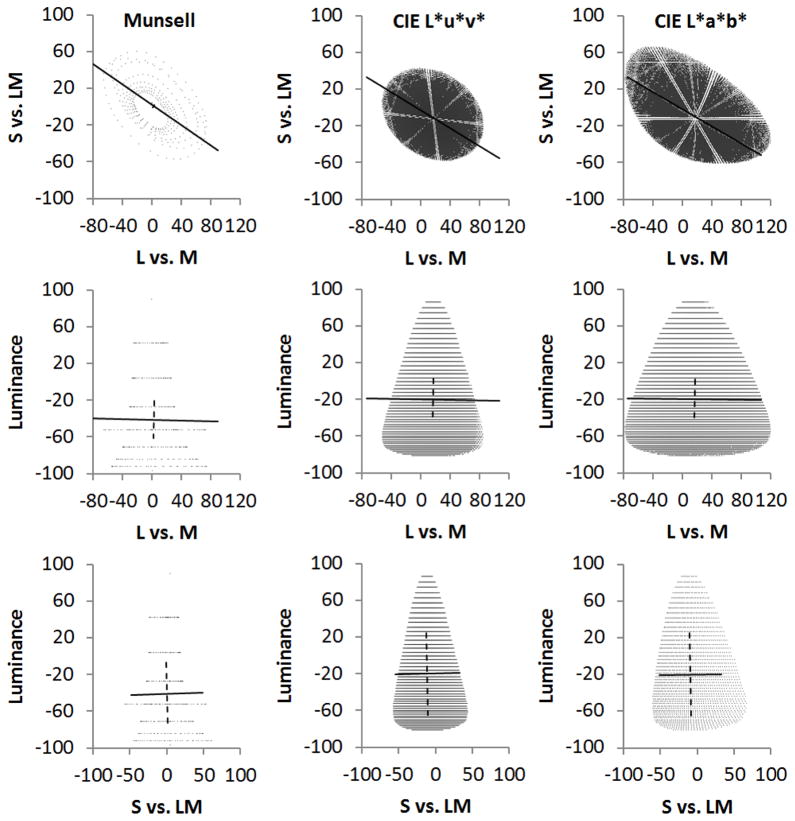
Figure 1.
Spherical distributions in the Munsell (left), CIE L*u*v* (middle) or CIE L*a*b* (right) spaces projected into the cone opponent space. Each row plots the distributions along different pairs of the cardinal axes; top: the S vs. LM isoluminant plane; middle: luminance and LM plane; bottom: luminance vs. S plane. Lines show the axes of the first (solid) or second (dashed) principal components of the distributions in each of the projected planes.

