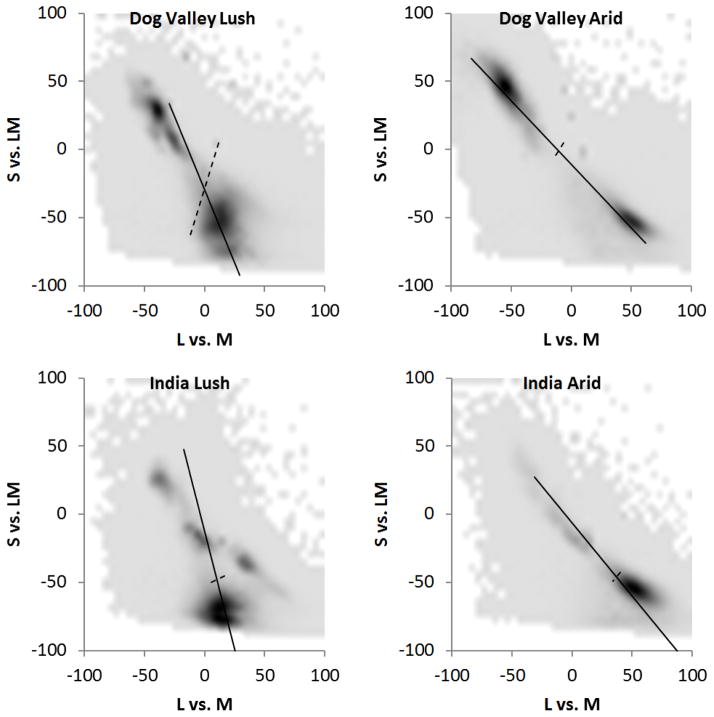
Figure 2.
Natural color distributions measured from two outdoor locations (top: Sierra Nevadas, USA; bottom: Western Ghats, India) and during two seasons (lush and arid)31. Plots show the pooled distributions of the chromaticities from individual scenes sampled in each environment. Lines show the axes of the first (solid) or second (dashed) principal components of the distributions in each of the projected planes.

