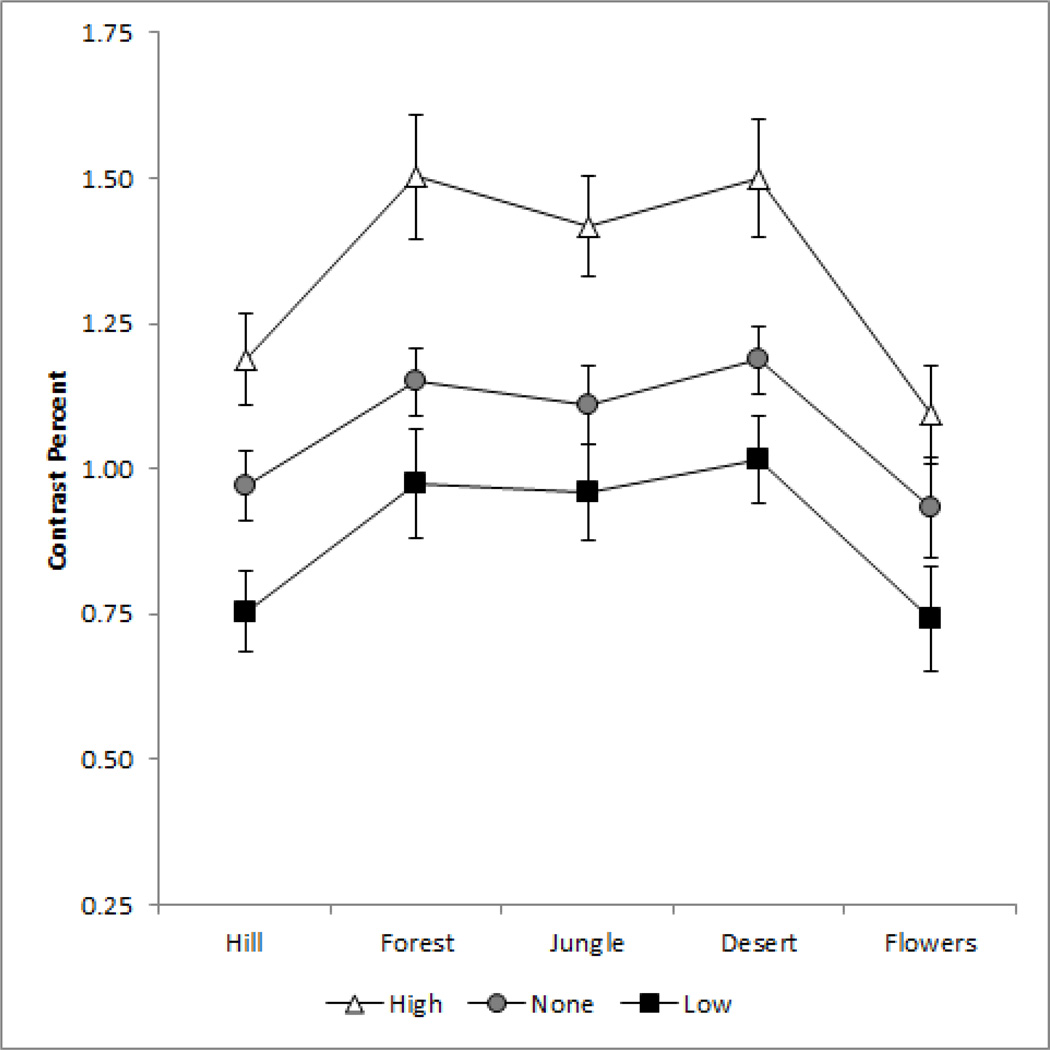
Figure 7.
Scaling at which the grayscale images appeared to have the correct contrast relative to the original contrast. Each point plots the mean settings for 7 observers ±1 SE for a different image, under neutral adaptation to the gray field (gray circles) or after adapting to the same image displayed at 0.5x (black squares) or 1.5x (unfilled triangles) the original contrast.

