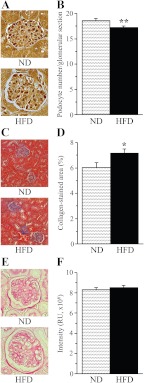
Fig. 2.
Representative microphotographs of glomerular podocyte immunostainings and podocyte counts (A and B), representative microphotographs and percentage of positively stained for collagen areas (C and D),and representative microphotographs and color intensities of PAS-positive substance stainings (E and F) in the renal cortex of mice fed normal or high-fat diets. Magnification, ×200 (C) and ×400 (A and E). ND, Mice fed a normal diet; HFD, mice fed HFD. Mean ± sem, n = 10–13 per group. *, **, P < 0.05 and P < 0.01 vs. group fed normal diet.

