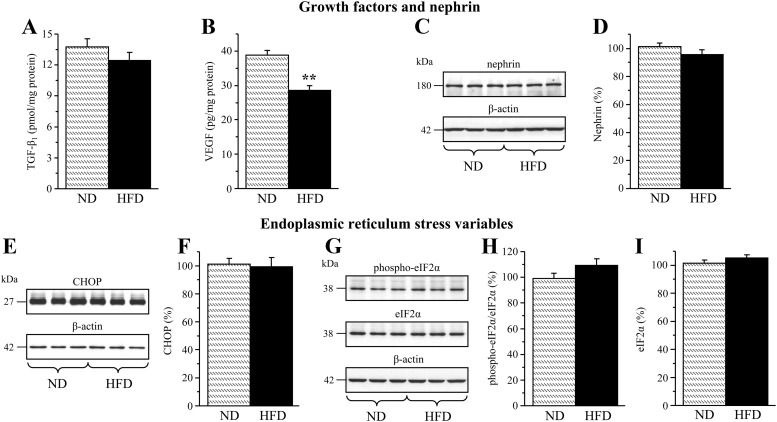
Fig. 3.
TGF-β1 (A) and VEGF (B) concentrations and representative Western blot analyses of nephrin (C), CHOP (E), and phosphorylated and total eIF2α (G); and protein contents (densitometry) of nephrin (D), CHOP (F), and phosphorylated (H) and total eIF2α (I) in the renal cortex of mice fed normal or high-fat diets. ND, Mice fed a normal diet; HFD, mice fed a HFD. Mean ± sem, n = 10–14 per group. **, P < 0.01 vs. group fed normal diet.

