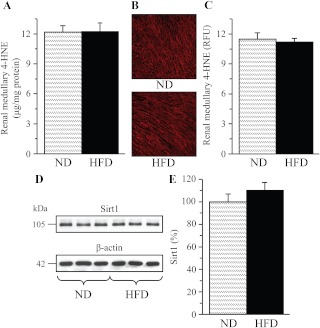
Fig. 5.
4-HNE adduct concentrations (A); representative microphotograph of 4-HNE immunostaining (B, magnification, ×100) and 4-HNE relative fluorescence intensities (C); and representative Western blot analysis of Sirt 1 (D) and Sirt 1 protein content (E) in the renal medulla of mice fed a normal or high-fat diets. ND, Mice fed a normal diet; HFD, mice fed a high-fat diet. Mean ± sem, n = 6–8 per group.

