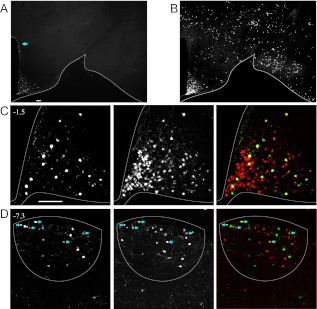
Fig. 4.
POMC neurons represent a minority of the cells labeled with a Pomc-Cre;R26R-TOM reporter in adulthood. A–D, Confocal images of direct TOM fluorescence in conjunction with IHC for GFP in 10-μm sections from adult Pomc-eGFP;Pomc-Cre;R26R-TOM animals. A and B, Low-magnification (×4) images of GFP+ (A) and TOM+ (B) populations in the hypothalamus at the level of the ARH (A–C). D, Expression in the AP of the hindbrain. A, Arrow designates the periventricular zone of the dorsal hypothalamus. C and D, Higher-magnification (×20) images of the ARH (C) and AP (D). For each section, GFP IHC is in the left panel, direct TOM fluorescence is in the center panel, and merged composites are in the right panels. Atlas coordinates are indicated. D, Arrows indicate double positive GFP/TOM cells. Scale bars, 100 μm.

