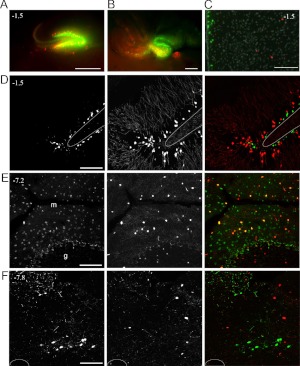
Fig. 5.
Expression of the Pomc-eGFP reporter in the absence of a Pomc-Cre;R26R-TOM reporter is observed in several brain regions in Pomc-eGFP;Pomc-Cre;R26R-TOM mice. A and B, ×2 images of direct GFP and TOM fluorescence visualized from the ventricular surface in hemisected brains from P9. A, Hippocampus. B, Cerebellum. C, Third ventricle of an adult hypothalamus, dorsal to the ARH; 4′,6-diamidino-2-phenylindole staining is presented in gray. D–F, ×20 of GFP IHC (left, green in merge), direct TOM fluorescence (center, red in merge), and the merged image (right) in 10-μm sections from adult animals. D, DG. E, Cerebellum. F, NTS. Coronal atlas coordinates are indicated. Scale bars, 500 μm (A and B) and 100 μm (C–F).

