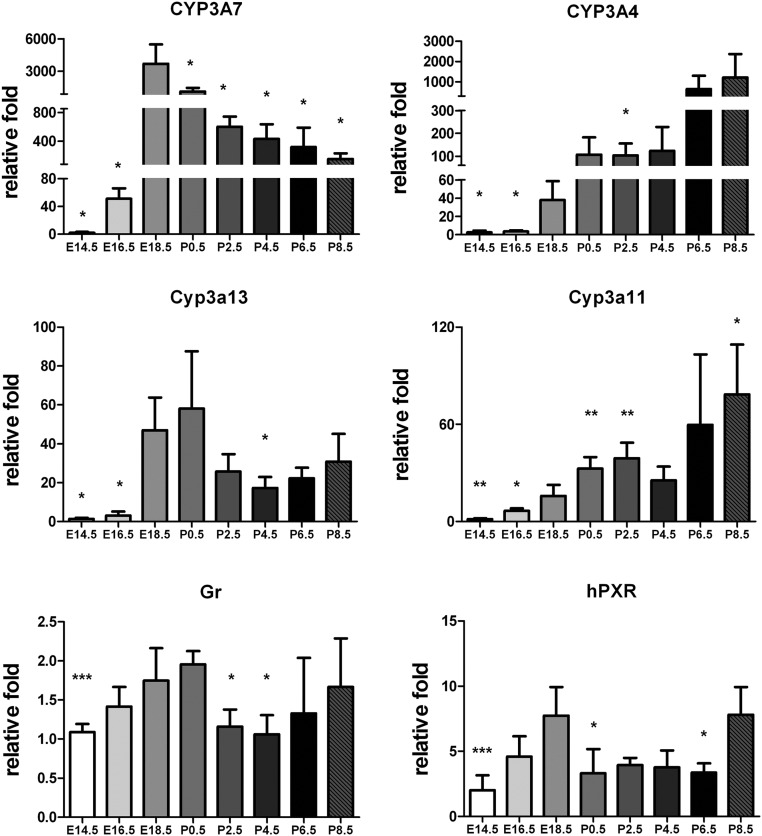
Fig. 1.
qPCR analysis of mRNA in the livers of Tg3A4/7-hPXR mice at different developmental days: E14.5, E16.5, E18.5, P0.5, P2.5, P4.5, P6.5, and P8.5. The profiles are shown of PXR typical target genes, CYP3A and nuclear receptors hPXR and murine GR, at different developmental days. The mRNA expression levels were quantitated by the ΔΔCt method using β-actin as an internal control. The relative fold of expression level at different developmental stages is expressed as mean ± sd; n = 5. *, P < 0.05; **, P < 0.01; ***, P < 0.001 compared with mice born at E18.5.

