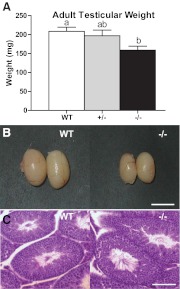
Fig. 1.
Tacr3−/− male mice have lower testicular weight but apparently normal spermatogenesis. A, Mean ± sem of testicular weight of WT, Tacr3+/−, and Tacr3−/− males. Different letters above error bars represent groups that are statistically different, P < 0.05, one-way ANOVA. B, Testicles from WT and Tacr3−/− males. Scale bar, 0.5 cm. C, Histology of testicular cross-sections stained with H&E at ×10 magnification. Scale bar, 0.1 mm. Note the open lumen of seminiferous tubules and tail of mature spermatozoa.

