FIGURE 5.
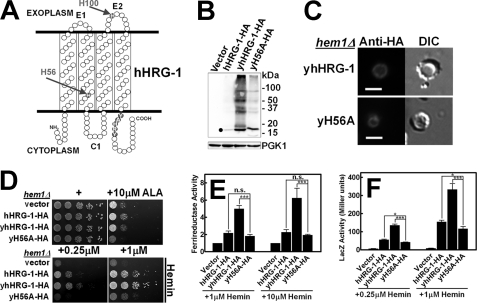
Heme transport analysis of wild-type and mutant hHRG-1. A, putative topology of hHRG-1 predicted by TMHMM 2.0 and SOSUI. The N and C termini are cytoplasmic, C1 is the cytoplasmic loop, and E1 and E2 are the exoplasmic loops. Potential heme interacting residues are shaded in red. B, immunoblotting was performed on transformants overexpressing C-terminal HA epitope-tagged hHRG-1 or yhHRG-1 and its H56A mutant (yH56A-HA) in the hem1Δ(6D) strain. The predicted molecular mass of hHRG-1 was detected as indicated by filled circles. The endogenous expression level of phosphoglycerate kinase 1 (PGK1) was used as loading control (30 μg of total protein/lane). C, immunofluorescence microscopy results of yhHRG-1-HA and yH56A-HA mutant in the hem1Δ(6D) strain. Rabbit anti-HA was used as the primary antibody, and an AlexaFluo568-conjugated goat anti-rabbit antibody was used as the secondary antibody. Scale bar, 5 μm. D, the hem1Δ(6D) strain was transformed with empty vector pYes-DEST52, hHRG-1 and its mutants. A spot growth assay was performed with the indicated conditions. Plates were incubated at 30 °C for 3 days prior to imaging. E, the hem1Δ fre1Δ fre2Δ MET3-FRE1 strain was transformed with empty vector pYes-DEST52, hHRG-1, and its mutants. A ferric reductase assay was performed with the indicated concentrations of hemin. Ferric reductase activity (nanomoles/106 cells/min) was measured and normalized to the activity of vector. F, the hem1Δ(6D)) strain co-transformed with pCYC1-LacZ and empty vector pYes-DEST52, CeHRG-1, or its mutants. β-Galactosidase activity was measured. Error bars represent the ±S.E. from three independent experiments. *, p < 0.05; **, p < 0.01; and ***, p < 0.001.

