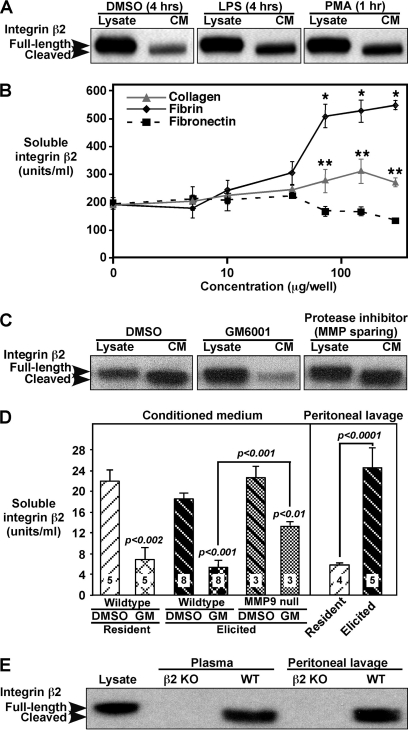
FIGURE 1.
Integrin β2 on mouse peritoneal macrophages is constitutively and inducibly shed from the cell surface. A–D, mouse peritoneal macrophages were harvested 4 days post-thioglycollate (elicited macrophages). Cell extracts (lysate, 30 μg) and conditioned medium (CM, 20 μl) were separated by 4–12% gradient SDS-PAGE and analyzed by Western blotting with anti-mouse integrin β2 or by ELISA. A, control diluent (4 h), LPS (100 ng/ml, 4 h), and phorbol 12-myristate 13-acetate (PMA) (100 ng/ml, 1 h) treatment of elicited macrophages plated on bacterial plastic dishes for 16 h before treatment. B, elicited macrophages were plated on tissue culture plates or increasing concentrations of fibrin-, fibronectin-, or collagen-coated tissue culture plates for 4 h, and conditioned medium was evaluated by ELISA. Means ± S.E. (n = 4/condition). *, p < 0.0001; **, p < 0.015 relative to medium from macrophages on plastic. C, elicited macrophages were incubated with diluent control (DMSO), the metalloproteinase inhibitor GM6001 (50 μm), or a mixture of metalloproteinase-sparing protease inhibitors, and lysates (15 μg) and conditioned medium (CM, 30 μl) were evaluated by Western blot. D, left panel, mouse resident peritoneal macrophages and elicited macrophages were plated as described for A, and 4 h media were collected and analyzed by ELISA for soluble integrin β2. The p values for GM6001 treatments versus paired DMSO conditions are shown above the GM6001 (GM) bars, and comparisons between different groups are indicated above connecting bars. Right panel, integrin β2 levels were determined by ELISA for peritoneal lavage fluid collected with resident and 4-day elicited macrophages. Means ± S.E. (n indicated in bars). E, Western analysis of peritoneal lavage fluid and plasma from wild type (WT) C57BL/6 mice and integrin β2 knock-out mice (KO) shows a lower molecular mass band for integrin β2 relative to lysate only in WT mice. Western data in this figure are representative of more than four replicate experiments.

