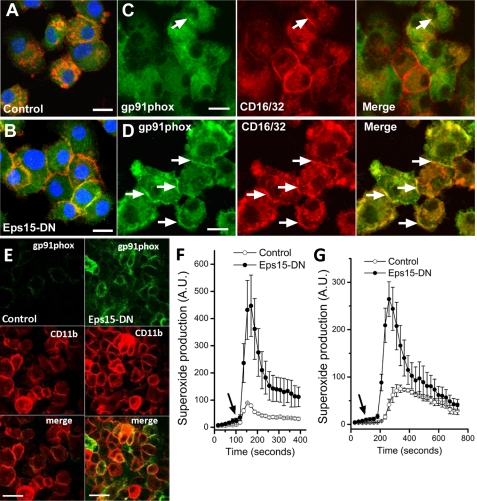
FIGURE 4.
Expression of dominant negative Eps15-EH29 mutant inhibits clathrin-coated pit endocytosis and retains NADPH oxidase at the cell surface. A and B, control and Eps15-EH29-expressing Ra2 microglia were incubated for several hours with 10 μg/ml monomeric rabbit IgG. Subsequently, immunofluorescence was performed with anti-gp91phox mAb (green) followed by Alexa 488 goat anti-mouse antibodies, Alexa 568-conjugated goat anti-rabbit antibodies to detect rabbit IgG, and ToPro-3 to visualize the nucleus (blue). Note that control cells efficiently internalize and concentrate rabbit IgG in endosomes and lysosomes (A), although expression of Eps15-EH29 traps bound rabbit IgG on the cell surface (B). Control (C) or Ra2 Eps15-EH29-expressing (D) cells were GM-CSF-starved for 20 h and processed for immunofluorescence with anti-gp91phox mAb 54.1 (green) and rat anti-CD16/32 mAb (red). Note increased co-localization (yellow) of CD16/32 and gp91phox on the cell surface of Eps15-EH29 cells (arrows in C and D). Bars, A–D, 10 μm. E, Ra2 cells expressing CFP-(h)gp91phox with or without expression of Eps15-EH29 were cell surface-labeled on ice with FITC-conjugated anti-(h)gp91phox mAb 7D5. Immunofluorescence was then performed with rat anti-CD11b mAb (red), and 7D5 mAb was visualized (further) by secondary Alexa 488-conjugated goat anti-mouse antibodies. F and G, control (open dots) or Eps15-EH29-expressing (filled dots) Ra2 microglia were stimulated with fMLP (F) or PMA (G), and superoxide release was measured by luminol ECL. Injection of fMLP or PMA is marked by arrows. The ordinate in arbitrary units (A.U.) represents ECL counts/s normalized to control cells. Mean ECL and S.E. of five independent experiments are shown in F and G.

