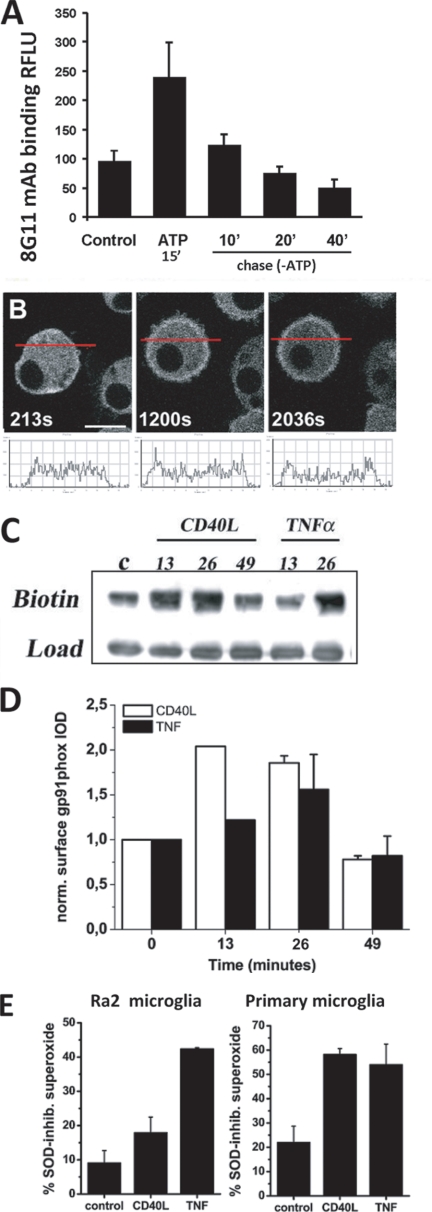
FIGURE 8.
ATP, TNF-α, and CD40L induce exocytosis of cyt b558-containing vesicles to the cell surface, which is followed by re-internalization of cyt b558. A, Ra2 microglia were stimulated with 1 mm ATP for 15 min and then chased in the absence of ATP for a further 10, 20, or 40 min. Then cell surface levels of gp91phox were determined by a FACS protocol on fixed unpermeabilized cells using 8G11, an anti-gp91phox mAb with an extracellular epitope on gp91phox. The graph depicts background-subtracted (isotype-matched control) mean fluorescence intensity of 8G11 staining normalized to unstimulated control Ra2 cells and represents mean ± S.E. (n = 3). RFLU, relative fluorescent light units. B, Ra2 cells expressing CFP-gp91phox were stimulated with 1 mm ATP, and live cell imaging was performed. Shown are 1.0-μm confocal medial sections of a single cell over time (indicated in seconds) before and after ATP stimulation (at 250 s). Note that CFP-gp91phox fluorescence is redistributed in part from cytosol to the cell surface. A histogram of CFP fluorescence intensity as a function of linear distance across the cell (red line in images) is depicted below each confocal image. Bar, 10 μm. C, cell surface expression of gp91phox in Ra2 microglia after stimulation with 100 ng/ml CD40L or 20 ng/ml TNFα was followed over time (indicated in minutes) by cell surface biotinylation with NHS-biotin. The anti-gp91phox Western blot shown is representative of three independent experiments and shows streptavidin-precipitate (upper lanes) and cell lysate load control (C, lower lanes). D, mean ± S.E. (n = 3) densitometric values for gp91phox Western blots as shown above. The ordinate in arbitrary units represents gp91phox band optical density of streptavidin-precipitates normalized to load control. E, PMA-evoked production of superoxide by Ra2 microglia or primary microglia stimulated with CD40L or TNFα was estimated by NBT reduction assay with or without inclusion of 400 units/ml SOD. The ordinate represents the fraction of SOD-sensitive (extracellular) to total NBT (no SOD) absorbance at 570 nm after 15 or 30 min of PMA stimulation for CD40L and TNFα, respectively. Mean ± S.E. (n = 3) is shown.

