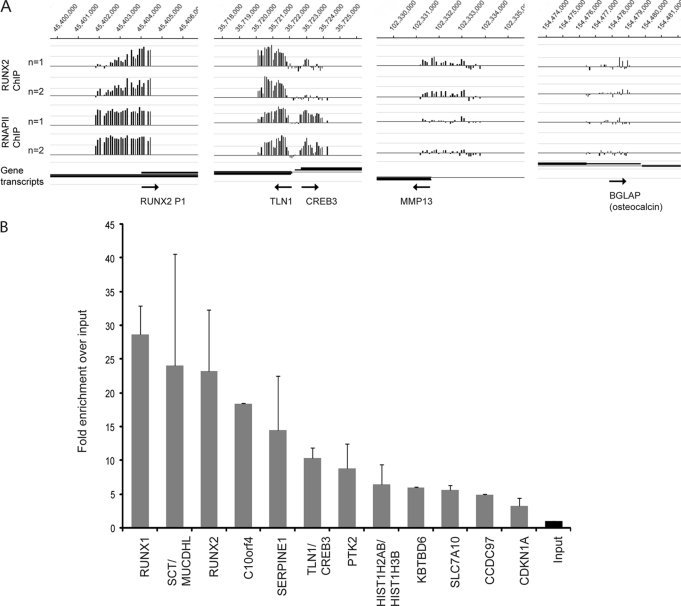
FIGURE 2.
RUNX2 occupancy in promoter regions identified with ChIP-on-chip experiments. A, in two independent experiments (n = 1 and n = 2), RUNX2 enrichment is high on its own P1 promoter, as well as on the shared TLN1-CREB3 promoter region. Enrichment is relatively low on the known RUNX2 target gene MMP13, and there is no significant enrichment on BGLAP (osteocalcin) that is not expressed in SAOS-2 cells. B, validation of RUNX2 targets with ChIP-qPCR. Averages are shown from two independent ChIP samples. Primers were designed around Runx motifs observed in peak regions identified in A (see supplemental Table S1 for exact locations within the peak). The fold enrichments observed in A and B are not directly comparable because the tiles in the Nimblegen promoter array do not match the amplicons of the qPCR primers.

