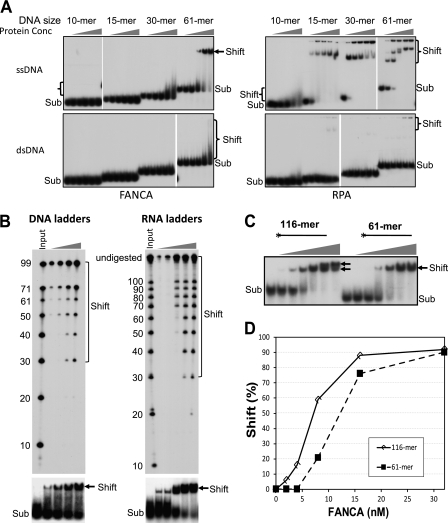
FIGURE 2.
FANCA requires large area of nucleic acids for optimal affinity. A, EMSA assays were performed by titration of FANCA and RPA with ssDNA and dsDNA of the indicated lengths. The concentrations of both FANCA and RPA were 0, 8, 16, 32, and 64 nm as indicated. The substrate concentration was 1 nm. The reactions were resolved in 90-min nondenaturing gel electrophoresis. The length of the DNA substrates is shown on top of each set of reactions. The protein-DNA complex is indicated by a bracket or an arrow. Sub, nucleic acid substrates. B, EMSA using DNA and RNA ladders (3 nm). The shifted bands (arrows) were recovered and resolved on a denaturing sequencing gel (upper panels). For DNA ladders, the concentrations of FANCA were 8, 16, 32, and 64 nm as indicated; for RNA ladders, the concentrations of FANCA were 2, 4, 8, 16, and 32 nm as indicated. Brackets indicated DNA or RNA species shifted by FANCA. DNA and RNA inputs with the indicated sizes in nucleotides are shown on the left of each gel. C, EMSA using 116- and 61-mer ssDNA oligonucleotides. The 32P-labeled 5′-end is indicated by an asterisk. The concentrations of FANCA were 0, 2, 4, 8, 16, 32, and 64 nm as indicated. Arrows indicate two different species of shifted bands. D, quantitation of EMSA experiments in C. Shift (%) is the ratio of the shifted band versus substrate band.

