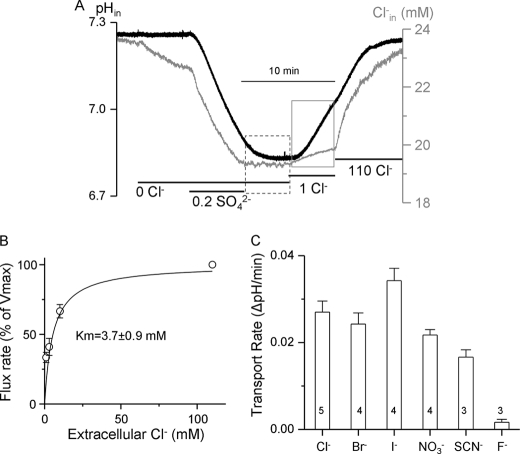
FIGURE 4.
Activation of Slc26a2-mediated SO42−i/OH−o exchange by Cl−o. A, example traces of Cl−i (black) and pHi (gray) in oocytes expressing Slc26a2. SO42−iflux was terminated by removal of SO42−o (period bordered by dashed line). SO42− efflux did not start until the addition of 1 mm Cl−o (period bordered by gray square), which triggered robust SO42−i/OH−o exchange with minimal SO42−i/Cl−o exchange. B, the relative rate of SO42−i/OH−o exchange is plotted as a function of the activating Cl−o. The rates at each Cl−o were normalized to the rate measured at 110 mm Cl−o, which was taken as 100%. The plot is the average of 3–5 experiments and fitted to the Hill equation. C, the protocol in A was used to measure activation of SO42−i/OH−o exchange by 1 mm of the indicated anions (period marked by gray square). The results are mean ± S.E. of the number of experiments indicated in the columns.

