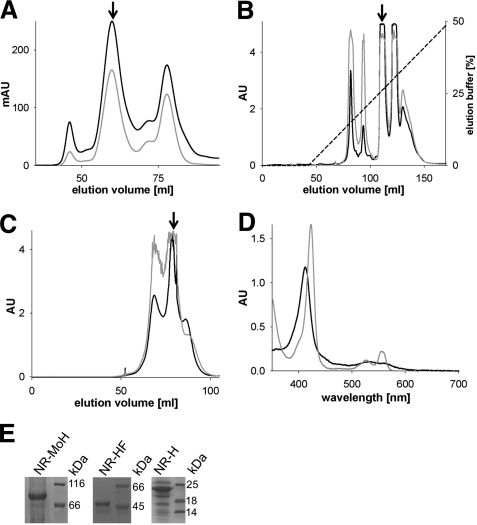
FIGURE 2.
Purification and characterization of A. thaliana nitrate reductase fragments. A, size exclusion chromatography of the Mo-heme fragment, with the fragment peak labeled with an arrow; absorption was recorded at 280 (black trace) and 413 nm (gray trace). mAU, milliabsorbance units. B and C, anion exchange chromatography (B) and size exclusion chromatography (C) of the heme-FAD fragment. Arrows mark the heme-FAD-containing peaks; the recorded absorptions are depicted as above. D, UV-visible spectroscopy of the heme fragment (9.3 μm) in its oxidized state (black trace) and after reduction with sodium dithionite (gray trace). E, SDS-PAGE analysis of purified and concentrated Mo-heme (NR-MoH), heme-FAD (NR-HF), and heme fragments (NR-H). The proteins of the molecular mass standard are labeled in kDa. All proteins were initially purified by affinity chromatography.

