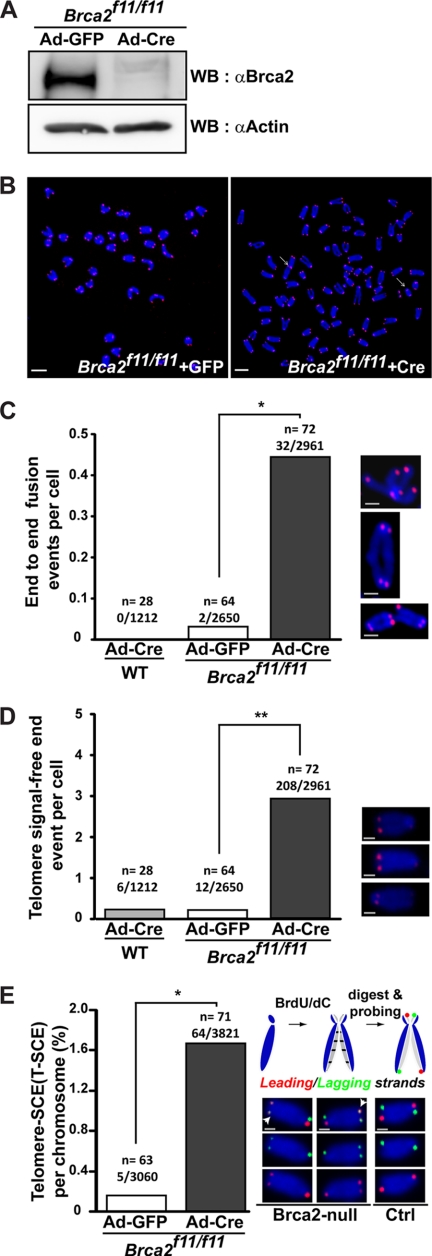
FIGURE 1.
Telomere attrition manifested as telomeric end-to-end fusions, telomere signal-free ends, and anaphase bridges in the absence of Brca2. A, Western blot analysis to assess the efficiency of Cre recombinase after Ad-Cre infection in Brca2f11/f11 MEFs. Lysates for Western blots (WB) were collected at the same time as telomere (T)-FISH in B. Brca2 disappears when Cre is expressed. Same blot was reprobed with anti-actin antibodies for normalization. B, Brca2f11/f11 MEFs or wild-type MEFs were infected with Ad-GFP or Ad-Cre. Five days post-infection, MEFs were subjected to T-FISH analysis. At least 28 metaphases from two independent MEFs of the same siblings were analyzed. Representative images of T-FISH in Brca2f11/f11 MEFs infected with Ad-GFP or Ad-Cre are shown. White arrows, chromosomes with end-to-end fusion or chromatid fusion. Scale bars, 5 μm. C, frequency of telomere end-to-end fusion events. Bar graphs indicate the frequency of telomere fusions in all chromosomes analyzed. x/y, total number of chromosomes with end-end fusion/number of chromosomes analyzed; n, number of cells analyzed. Enlarged images are shown at right. Scale bars, 1 μm. D, frequency of telomere signal-free ends. Bar graphs indicate the frequency of telomere SFEs in all chromosomes analyzed. x/y, total number of chromosomes with SFEs/number of chromosomes analyzed; n, number of cells analyzed. Representative images are shown at right. Scale bars, 1 μm. E, T-SCE measured in the presence (Ad-GFP) or absence (Ad-Cre) of Brca2. CO-FISH assay was performed 5 days post-adenoviral infection. Wild-type cells display lagging (green) and the leading (red) strand in a diagonal orientation in control (schematic diagram above, see also “Experimental Procedures”). Leading and/or the lagging strands appearing in the nondiagonal orientation are judged to result from the telomere sister chromatid exchanges and were observed in Brca2-null MEFs. T-SCEs are marked with white arrowheads. The results are from three independent experiments. x/y, total number of T-SCEs/number of chromosomes analyzed; n, number of cells analyzed. Representative images are shown at right. Scale bars, 1 μm (*, p < 0.05; **, p < 0.01; t test).

