FIGURE 3.
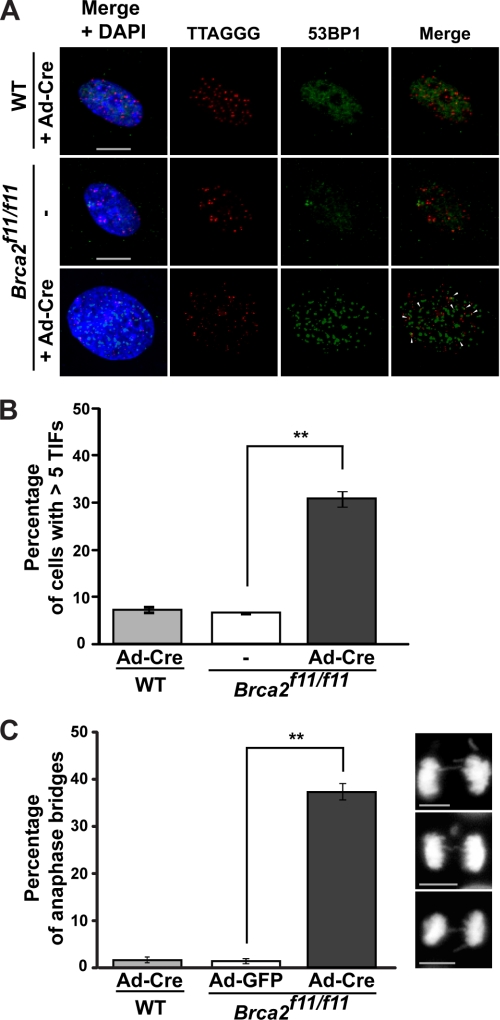
Increase in telomeric DNA damage in the absence of Brca2. A, TIF increase in Brca2-null MEFs. TIFs were analyzed using anti-53BP1 antibody (green) and PNA-conjugated telomere probe (CCCTAA, red) in Brca2f11/f11 MEFs 5 days post-infection with Ad-Cre. Wild-type MEFs infected with Ad-Cre were used for control. TIFs appeared as merged yellow foci and are marked with arrows. B, quantification of the TIFs shown in A. Bar graphs indicate the percentage of cells with >5 TIFs. Scale bar, 5 μm. C, quantification of anaphase bridges after Cre expression in wild-type or Brca2f11/f11 MEFs. MEFs were grown on coverslips and fixed with 4% paraformaldehyde, and the DNA was counterstained with DAPI. Two experiments were performed independently and scored in a blind manner. Images were acquired using AxioCam MRm camera on Zeiss Observer Z1 inverted microscope with ×40/0.6 NA lens (Zeiss). Bar graphs indicate the percentage of cells displaying anaphase bridges 5 days post-adenoviral infection. At least 63 cells in anaphase were analyzed. Error bars, standard deviation. Scale bars, 5 μm (**, p < 0.01; t test).

