FIGURE 4.
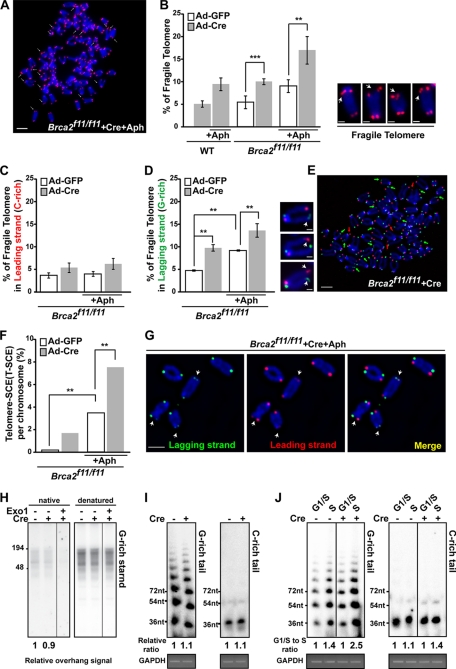
Replication block at the telomeres in the absence of Brca2. A, Brca2f11/f11 MEFs, infected with Ad-Cre, were subjected to telomere FISH after Aph treatment. Arrows depict chromosomes with fragile telomere. Bar, 5 μm. B, Brca2-deficient MEFs display marked increase of fragile telomeres. Brca2f11/f11 MEFs, infected with Ad-GFP or Ad-Cre, were subjected to telomere FISH after Aph treatment and analyzed. Wild-type MEFs were used as controls. Bars represent the percentage of fragile telomeres in total number of chromosomes analyzed, 5 days post-adenoviral infection. Representative images of telomere fragility are shown at the right. Scale bar, 1 μm. C and D, comparison of fragile telomeres in leading and lagging strands after Brca2 depletion. Brca2f11/f11 MEFs infected with Ad-GFP or Ad-Cre were subjected to CO-FISH after Aph treatment. Bars represent the percentage of fragile telomeres in leading or lagging strand, analyzed 2.5 days post-adenoviral infection. Representative images of telomere fragility are shown at the right. Scale bar, 1 μm. E, telomere fragility in lagging strands is higher compared with the leading strand in Brca2-deficient MEFs. Green arrowheads, fragile telomeres in lagging strand. Red arrowhead, fragile telomeres in leading strand. Scale bar, 5 μm. F, T-SCE measured in the presence (Ad-GFP) or absence (Ad-Cre) of Brca2 with/without Aph treatment. G, Brca2-deficient MEFs treated with Aph display a marked increase in T-SCE. Note the arrowheads, which indicate T-SCE. Scale bar, 5 μm. H, in-gel hybridization in a native gel and a denatured gel, using (CCCTAA)4 probe. DNA was extracted from Brca2f11/f11 MEFs, after infection with Ad-GFP or Ad-Cre. Telomere overhangs hybridize with the probe under the native condition (left), as exonuclease I (Exo1) treatment abolishes the radioactivity. Total telomere signals are obtained in the denatured condition. The relative radioactivity of telomere overhangs was obtained (marked as relative ratio) by normalizing the intensities of the hybridized radioactivity from the native condition to the denatured. Signals of control MEFs were set to 1. I, T-OLA analysis (28) of Brca2f11/f11 MEFs with oligonucleotides complementary to the G-rich tail (CCCTAA)3 or the C-rich tail (TTAGGG)3 2.5 days post-Ad-GFP (−Cre) or Ad-Cre (+Cre) infection. Relative hybridization intensity and length to the control are marked. GAPDH PCR product is shown for normalization of genomic DNA employed. J, Brca2f11/f11 MEFs infected with Ad-GFP or Ad-Cre were synchronized in G1/S by thymidine-aphidicolin block and then released into S phase progression by incubating in fresh media for 4 h. T-OLA assay was performed 2.5 days post-adenoviral infection. Relative intensity and length of T-OLA product in each lane are marked; the intensity of T-OLA product in G1/S in each setting is set to 1. PCR product of GAPDH is included for control. Error bars, standard deviation (**, p < 0.01; ***, p < 0.001; t test).

