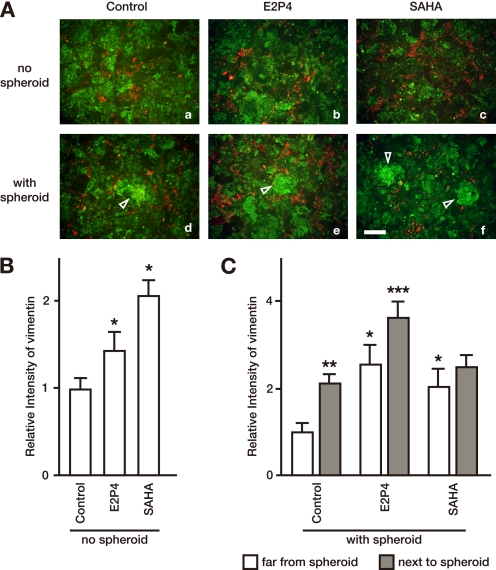
FIGURE 1.
Vimentin staining is up-regulated following treatment with either ovarian steroid hormones or SAHA, and following JAR spheroid implantation in Ishikawa cells. A, a confluent monolayer of Ishikawa cells was cultured without (a–c) or with DiO-coated JAR spheroids (d–f) and stained with anti-cytokeratin or anti-vimentin antibodies, followed by Cy2-conjugated or Cy3-conjugated secondary antibodies, respectively. Prior to the addition of JAR spheroids, Ishikawa cells were pretreated with E2P4 (b and e) or 2.0 μm SAHA (c and f) for 3 days. Bright green fluorescent JAR spheroids are indicated by white triangles. Bar, 200 μm. B, total area vimentin signal intensities in the Ishikawa monolayer, cultured alone for 3 days in the indicated medium, were measured in 500-μm square areas. Each bar represents the mean ± S.E. of relative intensity obtained from three independent experiments. Asterisks show significant differences compared with the intensity in Ishikawa cells cultured in the control medium (p < 0.05). C, total area vimentin signal intensities in Ishikawa monolayers pre-cultured with the indicated medium and co-cultured with JAR spheroids in refreshed medium containing no stimulants were measured in 200-μm square areas 400 μm away from a JAR spheroid (white bar) or adjacent to a spheroid (gray bar). Each bar represents the mean ± S.E. of relative intensity obtained from three independent experiments. Asterisks show significant differences compared with the intensity of the Ishikawa monolayer far from the spheroid in the control medium (single asterisks), compared between far from spheroids and next to spheroids in each medium (double asterisks), or compared with next to the spheroid in the control medium (triple asterisks) (p < 0.05).

