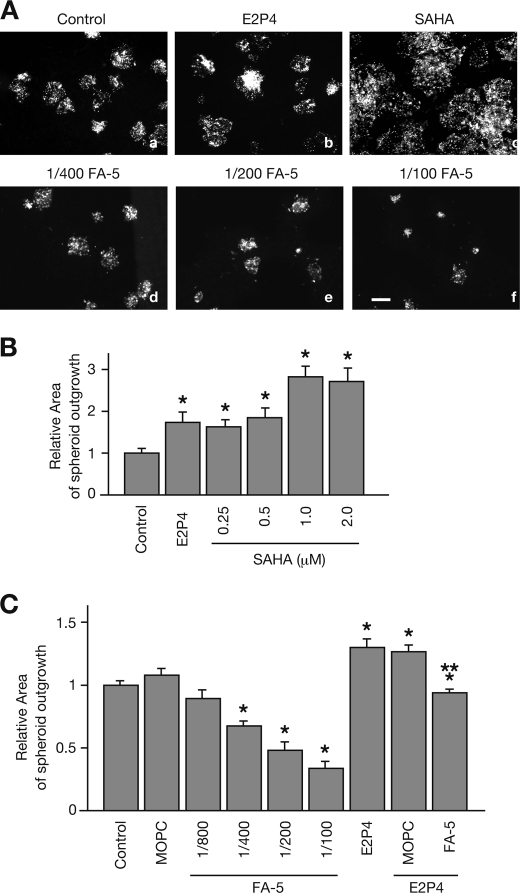
FIGURE 4.
JAR spheroids outgrowth in the in vitro implantation assay. A, prior to the addition of JAR spheroids, Ishikawa cells were pretreated without (a) or with E2P4 (b), SAHA (c), or the indicated concentrations of FA-5 (d–f). JAR spheroids were co-cultured with confluent monolayered Ishikawa cells for 24 h. B and C, JAR spheroid outgrowth areas were measured and graphed. Each gray bar represents the mean ± S.E. of relative area obtained from three independent experiments. Asterisks and double asterisks show significant differences compared with the area of JAR spheroids in unstimulated Ishikawa cells (Control) or E2P4-treated Ishikawa cells with no antibodies, respectively (p < 0.05).

