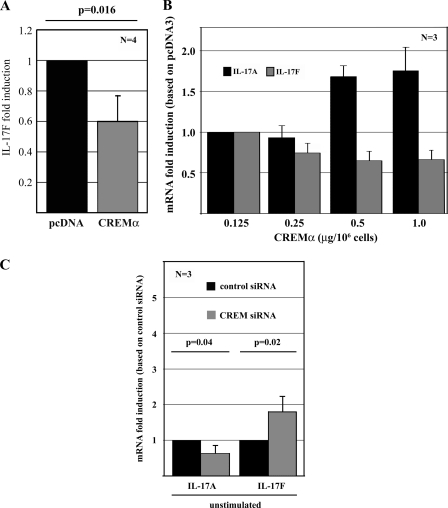
FIGURE 3.
CREMα down-regulates IL-17F expression. A, pcDNA3 or CREMα expression plasmid were transfected into primary human T cells and 5 h after transfection, RNA was analyzed for IL-17A and 18 S rRNA expression, using qRT-PCR. Experiments were performed in T cells from four different healthy blood donors. The bar diagram displays the mean relative IL-17F expression (after CREMα overexpression) ± S.D. (error bars) from four experiments. B, different concentrations (as indicated) of pcDNA3 or CREMα expression plasmid were transfected into Jurkat T cells. Five hours after transfection, mRNA was analyzed for IL-17A and 18 S rRNA expression, using qRT-PCR. The bar diagrams display the mean relative IL-17A (black bars) and IL-17F (gray bars) expression as induced by CREMα overexpression ± S.D. from three experiments. C, Jurkat T cells were transfected with 5 nm control and CREMα siRNA. Five hours after transfection, mRNA was analyzed for IL-17A and 18 S rRNA expression, using qRT-PCR. Cytokine expression levels in response to transfection with control siRNA were determined as a relative value of 1. Bar diagrams display the mean relative IL-17A and IL-17F expression as induced by CREMα knockdown ± S.D. from three unrelated experiments.

