FIGURE 3.
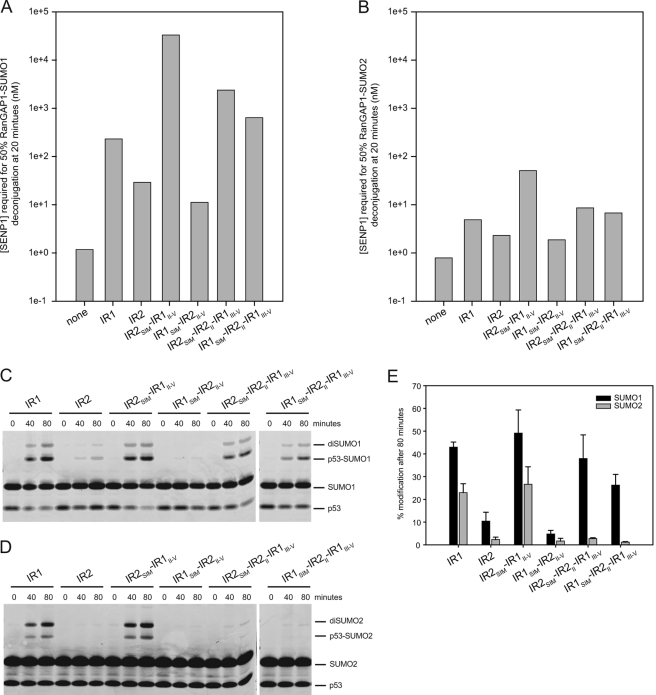
Activities of RanBP2 IR1 and IR2. A and B, bar graphs indicating the concentration of SENP1 required to deconjugate 50% of RanGAP-SUMO in the presence of UBC9 and indicated RanBP2 constructs for RanGAP-SUMO1 (A) and RanGAP-SUMO2 (B) as interpolated using data obtained from three independent experiments (supplemental Figs. 1 and 2). C, time course of SUMO1 conjugation to p53 with the specified RanBP2 construct. D, same as C, except that conjugation assays were performed with SUMO2. E, bar chart displaying quantitation of the conjugation assays shown in C and D. Assays were performed in triplicate. Error bars represent ± 1 S.D.

