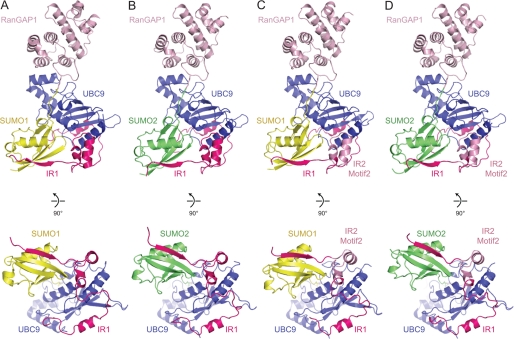
FIGURE 4.
Structures of RanGAP1-SUMO/UBC9/RanBP2 complexes. Schematics represent complexes containing RanGAP1-SUMO1/UBC9/IR1 (A; PDB 1Z5S), RanGAP1-SUMO2/UBC9/IR1 (B), RanGAP1-SUMO1/UBC9/IR1SIM-IR2II-IR1III–V (C), and RanGAP1-SUMO2/UBC9/IR1SIM-IR2II-IR1III–V (D). SUMO1, SUMO2, RanGAP1, UBC9, IR1, and IR2 motif II are displayed in yellow, green, light pink, blue, magenta, and pink, respectively. Lys524 of RanGAP1 and the SUMO C-terminal glycine (Gly97 for SUMO1, Gly93 for SUMO2) and are in stick representation. A rotated view of each complex is shown below each panel to highlight the position of SUMO and the IR1 SIM with respect to UBC9. Structural figures were generated with PyMOL (38).

