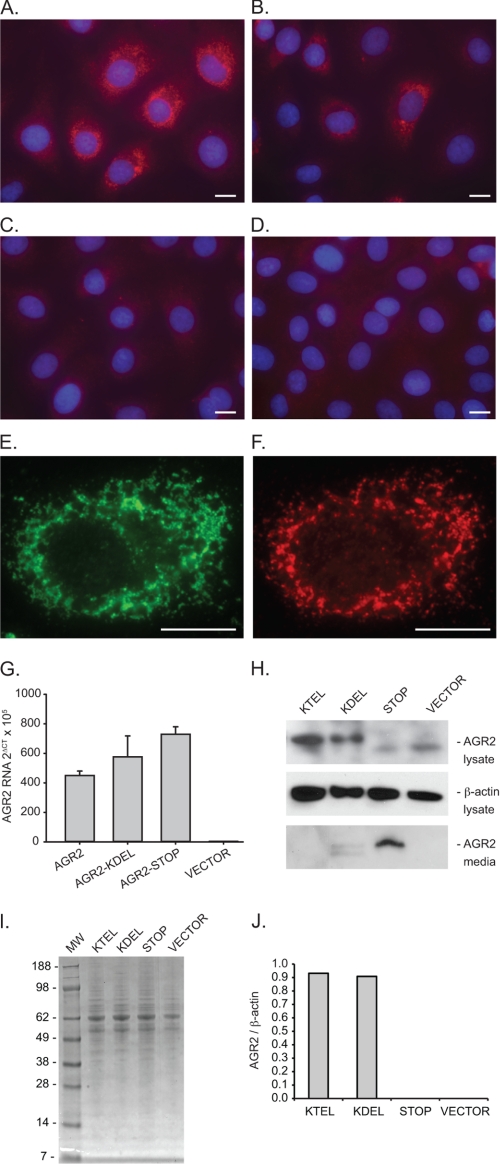
FIGURE 1.
AGR2 expression in rat intestinal IEC-6 cells. A–D, immunofluorescence images of IEC-6 cells transfected with AGR2 constructs terminating with a carboxyl-terminal KTEL (A), KDEL (B), or a STOP inserted before the wild-type KTEL (C) sequence. D, cells transfected with the expression vector alone. A–D, anti-AGR2 antibodies (red) and nuclear DAPI staining (blue). E and F, representative IEC-6 cell transfected with wild-type AGR2 and labeled with anti-KDEL (E, green) and anti-AGR2 (F, red) antibodies. The white bars in the images equal 10 μm. G, real time quantitative PCR determination of AGR2 RNA from transfected IEC-6 cells. The error bars represent S.D. H, protein immunoblots of transfected IEC-6 cell lysates (anti-AGR2 and anti-β-actin) or concentrated media (anti-AGR2). I, Coomassie Blue-stained SDS-PAGE of culture media depicted in H to show protein loading. J, graph of AGR2 protein levels as determined by densitometry of the immunoblot in H. The values are normalized by the corresponding β-actin band density.

