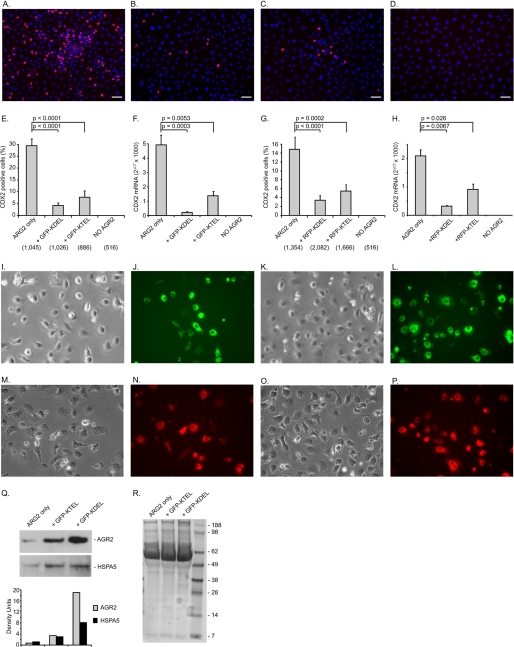
FIGURE 3.
CDX2 induction is mediated by binding to the KDEL receptors. Shown are the effects of expression with GFP and RFP proteins terminated at the carboxyl terminus with KDEL or KTEL on CDX2 expression in IEC-6:AGR2-KTEL cells. A–D show anti-CDX2 (red) and DAPI (blue) staining in IEC-6 cells transfected with AGR2 alone (A), AGR2 + GFP-KDEL (B), AGR2 + GFP-KTEL (C), and expression vector alone and no AGR2 (D). The white bars represent 50 μm. E, proportion of CDX2-positive cells for the constructs shown in A–D as quantified with ImageJ software. The total number of cells counted as determined by DAPI staining is listed in parentheses below the abscissa. F, real time quantitative PCR of CDX2 RNA normalized to β-actin for the same cells shown in E. G, proportion of CDX2-positive cells for similar constructs as shown in E except that RFP was substituted for GFP. H, real time quantitative PCR of CDX2 RNA normalized to β-actin for the same cells shown in G. I–L, controls for GFP transfection efficiency (400× magnification). Phase contrast (I and K) and GFP fluorescence (J and L) of IEC-6-AGR2 cells transfected with GFP-KDEL (I and J) or GFP-KTEL (K and L) are shown. M–P, controls for RFP transfection efficiency. Phase contrast (M and O) and RFP fluorescence (N and P) of IEC-6-AGR2 cells transfected with RFP-KDEL (M and N) or RFP-KTEL (O and P) are shown. Q, culture media of the cells transfected with the GFP constructs were evaluated with protein immunoblotting with anti-AGR2 and anti-KDEL (HSPA5) antibodies. Below each lane is a column graph depicting the density of the bands. R, Coomassie Blue staining of equal amounts of culture media as a loading control.

