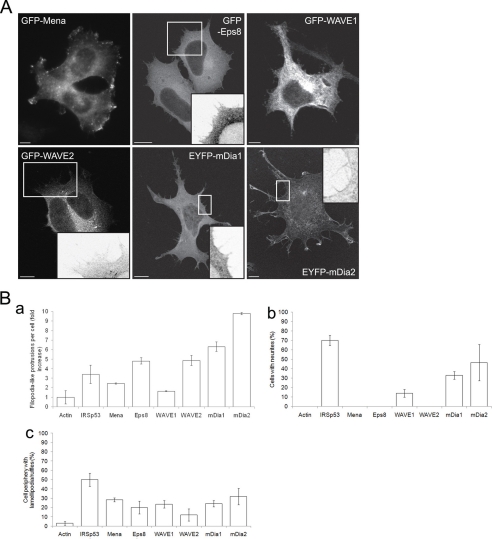
FIGURE 1.
Phenotype of putative IRSp53-interacting partners in neuronal cells. N1E115 cells transfected with fluorescence-tagged cDNA constructs were fixed at 20–38 h post-transfection. A, examples of cells overexpressing GFP-Mena, GFP-Eps8, GFP-WAVE1, GFP-WAVE2, EYFP-mDia1, and EYFP-mDia2. Magnified sections of cells are shown in the insets. Bar, 10 μm. B, quantification of morphological characteristics of transfected N1E115 cells. Panel a, fold increase in number of filopodium-like protrusions formed per transfected cell; panel b, percentage of transfected cells with neurites, and panel c, average percentage of cell periphery with lamellipodia/ruffles. Data are presented as mean ± S.E. (n = 15–58).

