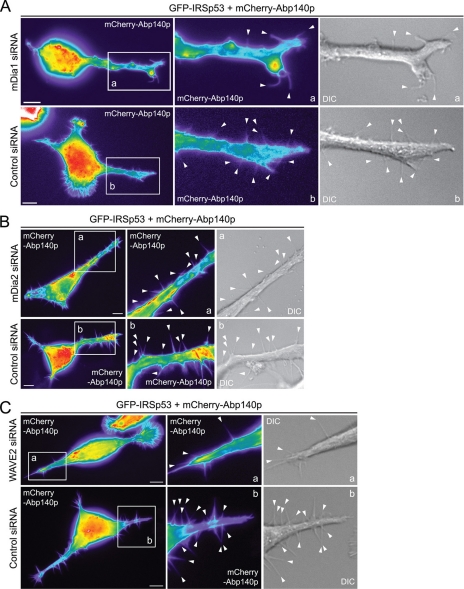
FIGURE 6.
IRSp53 filopodium formation involves mDia1 and WAVE2. A, N1E115 cells were cotransfected with GFP-IRSp53, mCherry-Abp140p, and either mDia1 or nontargeting control siRNA, and time-lapse imaging of GFP-positive cells done at 24 h post-transfection. Bar, 10 μm. Magnified sections of transfected cells are shown in panels a and b with arrowheads indicating individual filopodia. B, N1E115 cells were cotransfected with GFP-IRSp53, mCherry-Abp140p, and either mDia2 or nontargeting control siRNA, and time-lapse imaging of GFP-positive cells done at 40 h post-transfection. Bar, 10 μm. Magnified sections of transfected cells are shown in panels a and b with arrowheads indicating individual filopodia. C, N1E115 cells were transfected with GFP-IRSp53, mCherry-Abp140p, and either WAVE2 or nontargeting control siRNA, and time-lapse imaging of GFP-positive cells done at 42 h post-transfection. Bar, 10 μm. Magnified sections of transfected cells are shown in panels a and b with arrowheads indicating individual filopodia. For fluorescence images, fluorescence intensity is represented using a pseudocolor scale (from highest to lowest intensity: white, red, orange, yellow, green, blue, purple, and black) that allows structures with relatively low fluorescence intensity such as filopodia to be easily visualized.

