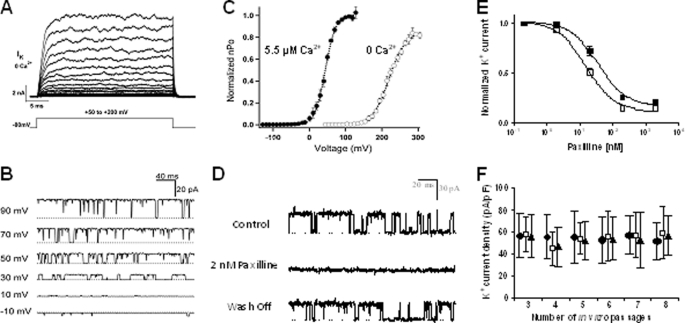
FIGURE 2.
RA-FLS express functional KCa1.1 channels at their plasma membrane. A, family of currents elicited from a whole cell with 0 Ca2+ internal solution by pulses from 50 to 200 mV in 10-mV increments. B, single channel currents recorded at different voltages from an inside-out patch in 5.5 μm Ca2+ and filtered at 5 kHz. Dotted lines indicate closed channels. C, normalized open probability (Po) versus voltage relations determined by measuring the normalized Po in multichannel patches (n = 5 at each [Ca2+]) and normalizing to Po(max) measured in single patches at 0 Ca2+ (○) and 5.5 μm Ca2+ (●). The curves were fit with Boltzmann functions. D, currents from RA-FLS before (control), during, and after (wash-off) treatment with 2 nm paxilline in the bath solution of an inside-out patch. E, dose-dependent inhibition by paxilline of whole-cell RA-FLS current (closed squares) or KCa1.1 currents stably expressed in HEK 293 cells (open squares) (n = 4–6 cells from three different donors). F, mean RA-FLS current density determined from cell capacitance and peak whole-cell current at +150 mV in 0 Ca2+ and plotted for each in vitro passage. 30–50 cells from three different donors (●, □, ▴) analyzed at each time point.

