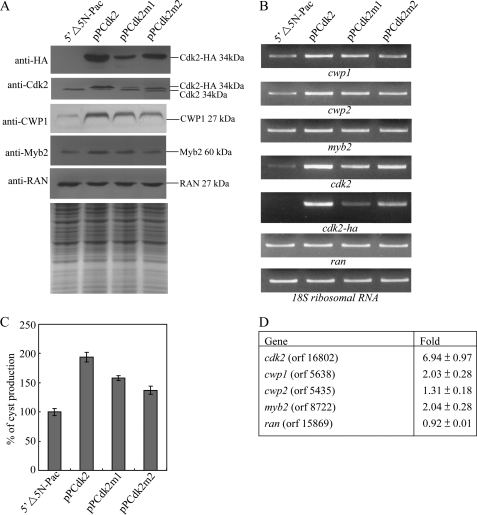
FIGURE 3.
Induction of cwp1, cwp2, and myb2 gene expression in the Cdk2 overexpressing cell line. A, overexpression of Cdk2 increased the levels of CWP1 and Myb2 proteins. The 5′Δ5N-Pac, pPCdk2, pPCdk2m1, and pPCdk2m2 stable transfectants were cultured in growth medium and then subjected to SDS-PAGE and Western blot. The blot was probed by anti-HA, anti-Cdk2, anti-CWP1, anti-Myb2, and anti-RAN antibodies. Equal amounts of protein loading were confirmed by SDS-PAGE and Coomassie Blue staining. Representative results are shown. B, RT-PCR analysis of gene expression in the Cdk2, Cdk2m1, and Cdk2m2 overexpressing cell lines. The 5′Δ5N-Pac, pPCdk2, pPCdk2m1, and pPCdk2m2 stable transfectants were cultured in growth medium and then subjected to RT-PCR analysis. PCR was performed using primers specific for cwp1, cwp2, myb2, cdk2, cdk2-ha, ran, and 18S ribosomal RNA genes. C, overexpression of Cdk2 increased cyst formation. The 5′Δ5N-Pac, pPCdk2, pPCdk2m1, and pPCdk2m2 stable transfectants were cultured in growth medium and then subjected to cyst count as described under “Experimental Procedures.” The sum of total cysts is expressed as relative expression level over control. Values are shown as mean ± S.E. D, microarray analysis. Microarray data were obtained from the 5′Δ5N-Pac and pPCdk2 cell lines during vegetative growth. Fold-changes are shown as the ratio of transcript levels in the pPCdk2 cell line relative to the 5′Δ5N-Pac cell line. Results are expressed as the mean ± S.E. of at least three separate experiments.

