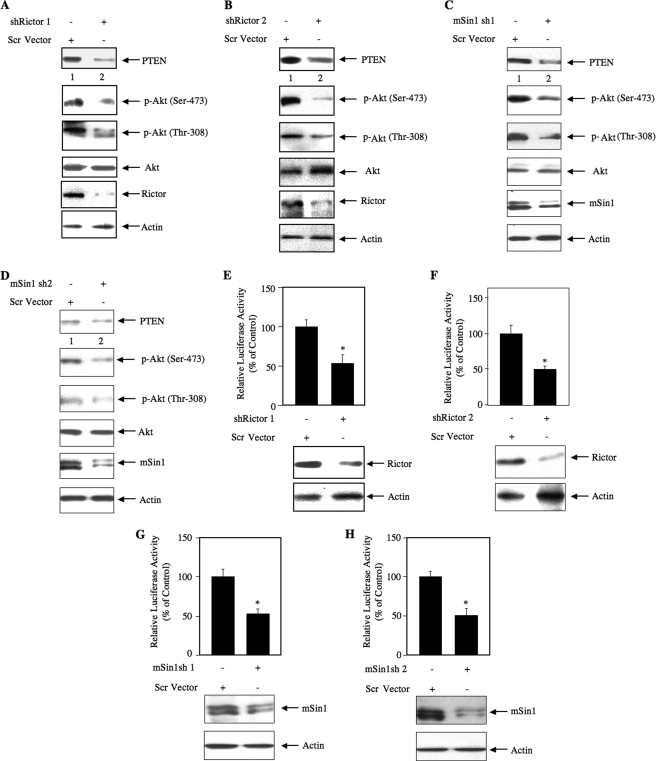
FIGURE 5.
Down-regulation of rictor and mSin1 prevents expression of PTEN and decreases Akt phosphorylation in 293 cells. A and B, 293 cells were transfected with two independent shRNA expression plasmids, shRictor 1 and shRictor 2, targeting two different regions in the rictor gene (500 ng) or scrambled (Scr) vector. C and D, 293 cells were transfected with two independent shRNA expression plasmids, mSin1 sh1 and mSin1 sh2, targeting two different regions in the mSin1 mRNA (500 ng) or scrambled vector. Forty-eight hours post-transfection, the cell lysates were immunoblotted with the indicated antibodies. E and F, 293 cells were cotransfected with PTEN-Luc along with shRictor 1 (E), shRictor 2 (F), mSin1 sh1 (G), or mSin1 sh2 (H) expression vector. The cells were harvested at 48 h post-transfection. The cell lysates were assayed for luciferase activity as described (41, 44, 45, 65). For E, mean ± S.E. of 12 measurements is shown. *, p = 0.002 versus control. For F, mean ± S.E. of six measurements is shown. *, p = 0.03 versus control. For G, mean ± S.E. of six measurements is shown. *, p = 0.04 versus control. For H, mean ± S.E. of six measurements is shown. *, p = 0.002 versus control. The expression of rictor and mSin1 is shown at the bottom of the histogram. p-Akt, phospho-Akt.

