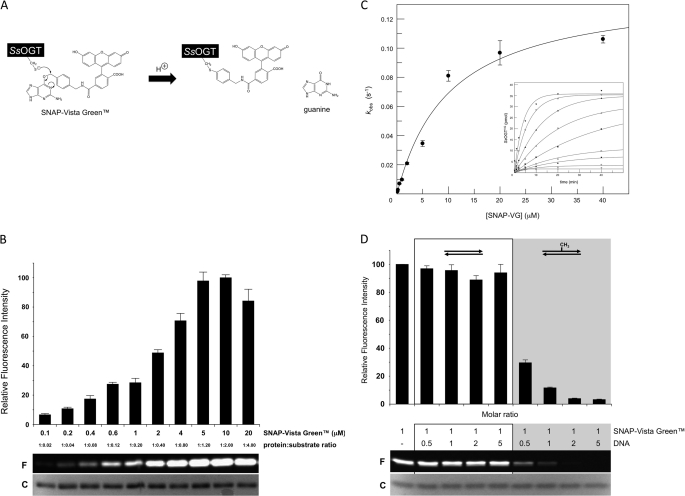
FIGURE 2.
Fluorescent assay for analysis of SsOGT activity. A, scheme of the assay with the fluorescent substrate/inhibitor SNAP-Vista GreenTM. B, 5.0 μm purified SsOGT was incubated with increasing concentrations of SNAP-Vista GreenTM, as indicated, under standard conditions and run on SDS-PAGE; a typical gel is shown where F indicates fluorescent protein-inhibitor bands and C indicates Coomassie Blue-stained bands. Histograms report the mean ± S.D. of the corrected data, obtained from gel imaging, from three independent experiments. C, plot of the first-order rate constants for covalent modification of SsOGT (kobs) as a function of SNAP-Vista GreenTM concentration. Rates values obtained from time-course experiments (inset) were fitted according to Equation 1. D, competition assay. 5.0 μm SsOGT were assayed under standard conditions at the indicated dsDNA/SNAP-Vista GreenTM molar ratios. Each lane contained ∼2.0 μg of protein. The histogram reports the quantification of data from two independent experiments, corrected as reported for panel B; symbols are as in panel B.

