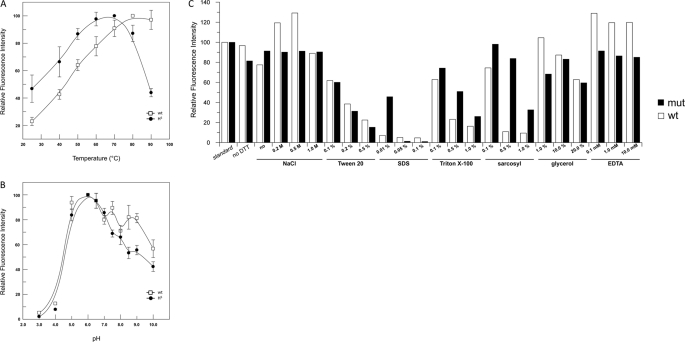
FIGURE 4.
Biochemical characterization of wild type SsOGT and SsOGT-H5. A, activity assay at different temperatures. Reactions were performed for 1.0 min under standard conditions except for the temperature used. The activity at the optimal temperature (80 and 70 °C for the wild type and H5 mutant, respectively) was referred to as 100%. Data are from two independent experiments for each assay. B, pH-dependent activity. Reactions were performed under standard conditions except for the pH and/or buffer used. The activity at the optimal pH (6.0) was referred to as 100%. Data are from two independent experiments for each assay. Error bars in panels A and B indicate mean ± S.D. C, assay under different reaction conditions. Reactions were in standard conditions, with the differences indicated in the histogram. Quantification was as described in the legend for Fig. 2. Data are from a single experiment for each condition. mut, mutant.

