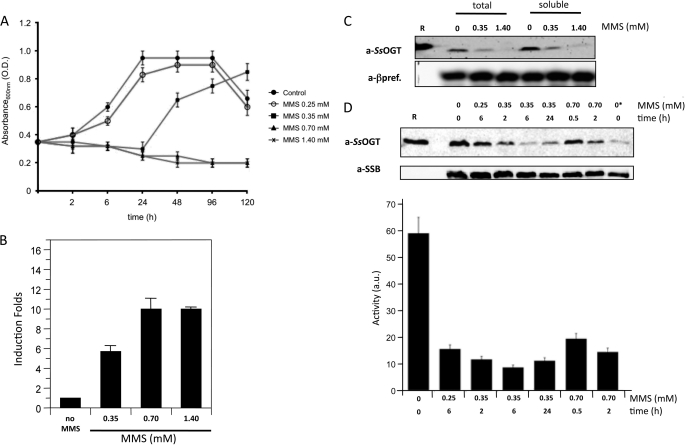
FIGURE 6.
SsOGT in DNA damage response. A, S. solfataricus P2 cultures were grown at 80 °C until the exponential phase (time 0). At this time, cultures were split, and MMS was added to each aliquot at the indicated concentrations; one aliquot was mock-treated. Absorbance at 600 nm was measured at the indicated time points. Values are from five independent experiments. O.D., optical density. B, real time RT-PCR. Quantification of the ogt RNA in S. solfataricus in the absence and after 1 h of treatment with MMS at the indicated concentrations is shown. Data are from four independent experiments. C, Western blot analysis of total and soluble protein extracts (50 μg/lane) from S. solfataricus cultures prepared 2 h after MMS or mock treatment at the indicated concentrations. R, 300 ng of purified recombinant SsOGT. a-βpref., anti-β-prefoldin. D, Western blot of soluble protein extracts (50 μg/lane) from cultures treated with the indicated MMS doses for the indicated times. R, 20 ng of purified SsOGT. In the lane with the asterisk, only 10 μg of control extract was loaded. All filters were stripped and probed sequentially with anti-SsOGT (to follow the endogenous SsOGT) and either anti-DNA single-strand binding protein or anti-β-prefoldin (to control for protein loading). The histogram shows the quantification of SsOGT level normalized to the level of the reference protein in each lane; data are from four independent experiments. Error bars in panels A, B, and D indicate mean ± S.D. a.u., arbitrary units.

