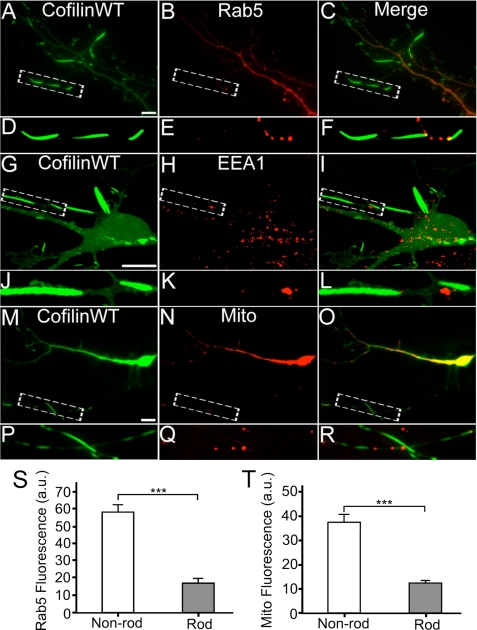
FIGURE 3.
Lack of intracellular organelles in cofilin rod areas. A and B, coexpression of RFP-cofilin WT (colored green, A) and GFP-Rab5 (colored red, B) in cultured hippocampal neurons. C, merged image. D–F, enlarged view revealing a lack of Rab5 puncta in rod areas. G and H, cofilin WT transfected neurons (G) and EEA1 immunostaining (H). I, merged image. J–L, enlarged view confirming the lack of early endosomes in rod areas. M–O, coexpression of RFP-cofilin WT (M) and GFP-Mito (N) to assess mitochondria distribution. P–R, enlarged view revealing a lack of mitochondria in rod areas. S, quantitative analysis of the average fluorescence intensity of GFP-Rab5 in rod regions (17.0 ± 2.7 a.u., n = 9, total rod length = 82 μm) versus non-rod areas (58.2 ± 4.4 a.u., n = 9, total non-rod dendritic length = 85 μm; ***, p < 0.001). T, quantitative analysis of the average fluorescence intensity of GFP-Mito in rod regions (13.0 ± 1.3 a.u., n = 8, total rod length = 76 μm) versus non-rod areas (37.1 ± 4.2 a.u., n = 8, total non-rod dendritic length = 101 μm; ***, p < 0.001). Scale bars, 10 μm.

