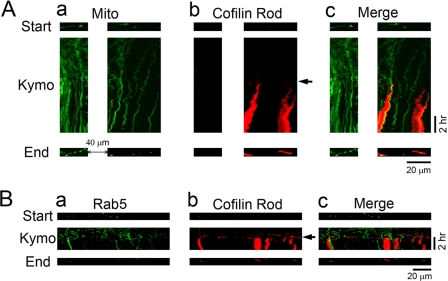
FIGURE 4.
Time-lapse imaging showing the block of intracellular trafficking by cofilin rods. A, changes of mitochondrial trafficking before and after cofilin rod formation. a, kymograph illustrating the spatial-temporal trajectory of GFP-Mito-labeled mitochondria (green) before and after rod formation. b, time-lapse imaging of the formation of cofilin rods labeled by RFP-cofilin (red). Arrow indicates the start of rod formation. c, merged view of mitochondria and cofilin rods. Note that the vertical lines of GFP-Mito signal in the kymograph represent arrested mitochondria, which coincides with the appearance of cofilin rods. Top and bottom rows, distribution of mitochondria in dendrites at the beginning and end of time-lapse imaging. Note that besides rod formation, the shape of mitochondria changed from elongated form into small round ones, suggesting possible functional change of mitochondria after rod formation. B, dendritic trafficking of early endosomes also blocked after cofilin rod formation. a, kymograph illustrating the moving trajectory of GFP-Rab5-labeled early endosomes (green) before and after cofilin rod formation. b, rod formation (indicated by arrow) labeled by RFP-cofilin (red). c, merged view of early endosomes and cofilin rods. Note that early endosomes ceased to move upon the appearance of cofilin rods. In addition, the number of early endosomes in the end of imaging (bottom row) was greatly reduced compared with the starting point before any rod formation (top row).

