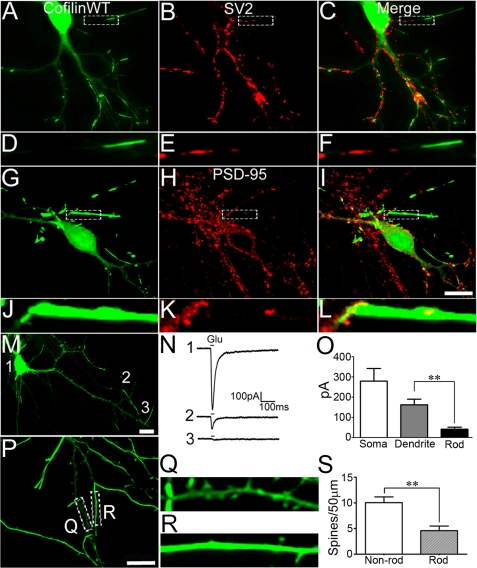
FIGURE 5.
Cofilin rods induce local synaptic loss. A–C, immunostaining of synaptic vesicle protein 2 (SV2), a presynaptic marker, in neurons transfected with GFP-cofilin WT revealing lack of SV2 puncta in rod areas. D–F, enlarged view of cofilin rods and SV2 staining. G–I, immunostaining for PSD-95, a postsynaptic marker, in GFP-cofilin WT transfected neurons showing loss of PSD-95 puncta within rod areas. J–L, enlarged view of cofilin rods and PSD-95 puncta. M, example of a cultured hippocampal neuron transfected with GFP-cofilin WT used for whole cell patch clamp recording. Local glutamate ejection (500 μm, 15 ms) was applied at soma (1), distal dendrite (2), and rod area (3). N, glutamate responses from the same neuron at locations shown in M. O, quantitative analysis of glutamate responses showing the average peak current from soma (279 ± 63 pA), dendrite (162 ± 28 pA), and rod areas (42 ± 10 pA) (p < 0.01; n = 7). Scale bars, 10 μm. P, GFP-cofilin-transfected neuron with substantial rod coverage (21 days in vitro). Q, dendritic segment without much rod coverage showing many spines. R, rod area with very few spines. S, quantitative analysis showing a significant reduction of spines in rod-containing dendrites (p < 0.001, n = 56 for non-rod branch, n = 18 for rod branch).

