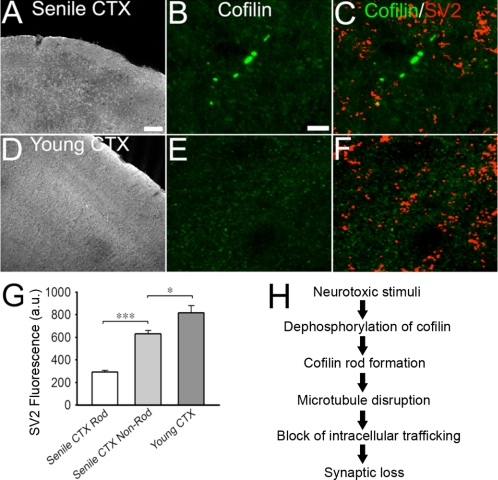
FIGURE 7.
Cofilin rods detected in aging rat brains. A, immunostaining of cofilin in coronal sections (30 μm) of cortex from senile rat (23 months). B, enlarged local cortical region from (A) showing cofilin rods. C, coimmunostaining of cofilin and SV2 in senile cortex. Note the lack of SV2-positivie puncta in rod areas. Average fluorescence intensity of SV2 in rod regions was 291 ± 15.6 a.u. (***, p < 0.001; 122 rods; ∼1,500 μm2) whereas non-rod areas was 630 ± 30.9 a.u. (∼4,777 μm2). Quantification is shown in G. D, immunostaining of young adult (3–4 months) rat cortex showed no cofilin rods. Cofilin signal was diffuse throughout cortex. E and F, coimmunostaining for cofilin and SV2 in young adult cortex. Average fluorescence intensity of SV2 in young cortex was 817 ± 64.1 a.u. (∼16,020 μm2). G, quantitative analysis of SV2 fluorescence intensity under various conditions. H, proposed model of cellular events from rod formation induced by neurotoxic stimulation to synaptic loss. Scale bar for A and D, 100 μm; for other panels, 10 μm.

