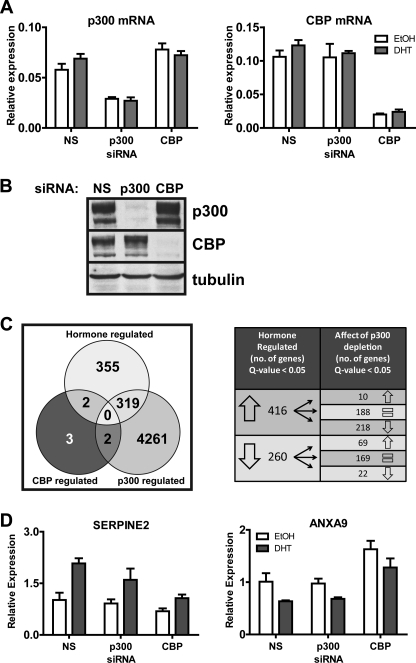
FIGURE 1.
Effects of p300 and CBP depletion on global and DHT-induced gene expression in C4-2B cells. A, qRT-PCR was performed on RNA extracted from cells transfected with siRNA against p300, CBP, or a nonspecific (NS) sequence. Cells were treated with ethanol (EtOH) or 10 nm DHT for 16 h before harvest. Levels of mRNA are shown relative to 18 S rRNA and represent the mean ± S.D. of three technical PCR replicates. B, whole cell extracts from cells transfected with siRNA were analyzed by immunoblot using antibodies against p300, CBP, or tubulin as a control. C, total RNA was extracted from cells transfected with siRNA and treated with DHT or ethanol as in A. Four independent experiments of this type were conducted on different days, and the 24 resulting RNA samples were analyzed on Illumina microarrays. The Venn diagram for the hormone-regulated gene set shows the number of genes with significantly different expression (q ≤ 0.05) for RNA from cells transfected with nonspecific siRNA and then treated with ethanol versus DHT. The Venn diagram for the p300-regulated gene set shows the number of genes with significantly different expression (q ≤ 0.05) for RNA from DHT-treated cells that had been transfected with nonspecific siRNA versus siRNA against p300. The Venn diagram for the CBP-regulated gene set shows the number of genes with significantly different expression (q ≤ 0.1) for RNA from DHT-treated cells that had been transfected with nonspecific siRNA versus siRNA against CBP. Overlap areas indicate the number of genes belonging to two or all three of the three gene sets. The table on the right depicts the number of genes up- or down-regulated with DHT and the number that are either up-regulated (↑), down-regulated (↓), or unchanged ( =) with p300 knockdown. The complete lists of genes for the three major sets in the Venn diagram are found in supplemental Tables 3–5. D, Illumina microarray results for the genes which were DHT-regulated and CBP-dependent. For each gene, expression is given relative to cells transfected with siNS and treated with ethanol and is plotted as the mean ± S.D. of four independent experiments.

