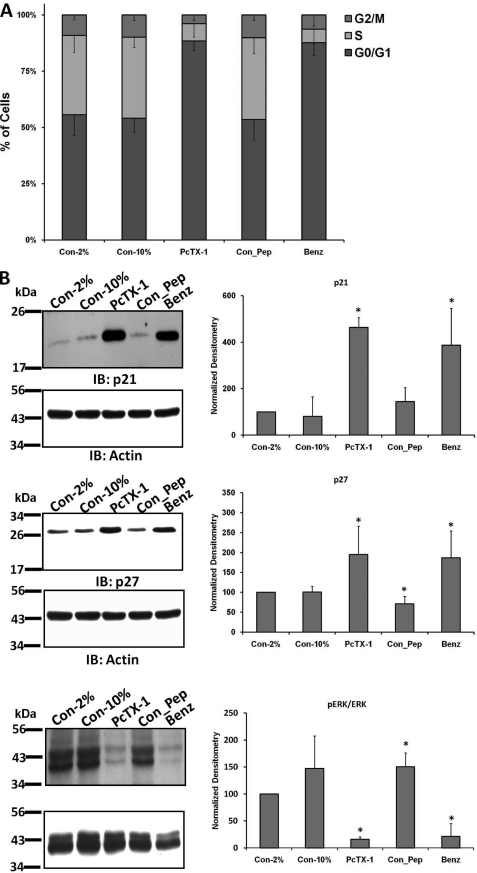
FIGURE 8.
Inhibition of glioma conductance caused cell cycle arrest and decreased phosphorylation of ERK1/2 in primary GBM cells. A, stacked bar graph represents the percentage of primary GBM cells in each cell cycle phase under different experimental conditions, n ≥6. B, expression of p21Cip1 and p27Kip1 and level of phospho-ERK1/2 in primary GBM cells treated with 100 nm PcTX-1, control peptide (Con_Pep), or 100 μm benzamil (Benz) for 24 h. Con, control. Each bar represents the normalized densitometry compared with control in 2% FBS, n ≥5 for each. IB, immunoblot.

