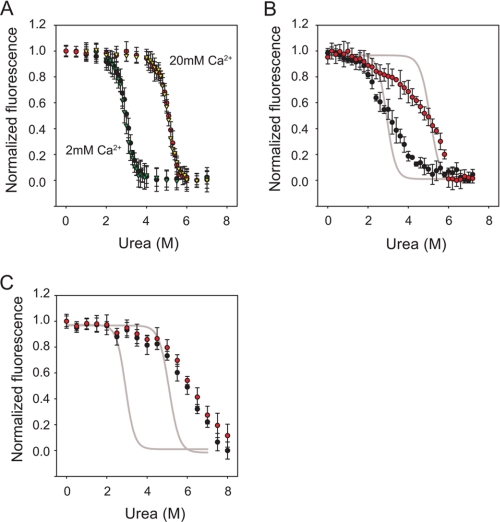
FIGURE 5.
Urea-induced unfolding of RTX, ΔN-AP, and AP proteins. Urea denaturation titrations were performed to assess the relative stabilities of the RTX and AP proteins. A, RTX proteins in 2 and 20 mm Ca2+ were assessed by monitoring changes in tryptophan fluorescence. Folding/unfolding transitions were reversible in both 2 and 20 mm Ca2+ and are shown as follows: unfolding, 2 mm Ca2+ (black circles); refolding, 2 mm Ca2+ (green triangles); unfolding, 20 mm Ca2+ (red circles); refolding, 20 mm Ca2+ (yellow triangles). B, unfolding of the ΔN-AP proteins at 2 mm Ca2+ (black circles) and 20 mm Ca2+ (red circles) is shown. Sigmoidal fits of the RTX unfolding transitions at 2 and 20 mm Ca2+ are shown in gray lines for reference. The increase in apparent stability as a function of increasing [Ca2+] from 2 to 20 mm was similar for both the RTX and ΔN-AP proteins. C, unfolding of the full-length AP is shown at 2 mm Ca2+ (black circles) and 20 mm Ca2+ (red circles). The RTX unfolding transition is shown as a gray line, as in B. Data are presented as mean ± S.D. (error bars).

