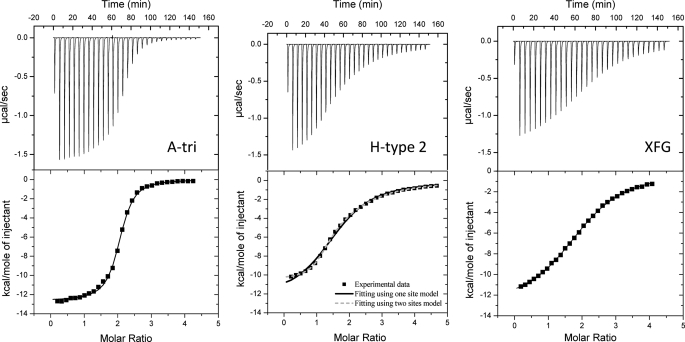
FIGURE 2.
Microcalorimetry data. The ITC plot (measured by VP-ITC, Microcal) was obtained from the titration of BambL (22–24 μm) with several oligosaccharides (concentrations from 0.4 to 0.5 mm) at 25 °C. Protein and glycans were prepared in 20 mm Tris/HCl, pH 7.5, and 150 mm NaCl. The plots in the lower panels show the total heat released as a function of total ligand concentration for the titration shown in the upper panels. The solid lines represent the best least-square fit to experimental data using a one-site model. A two-site model was been used for BambL-H-type 2 interaction (dotted lines).

