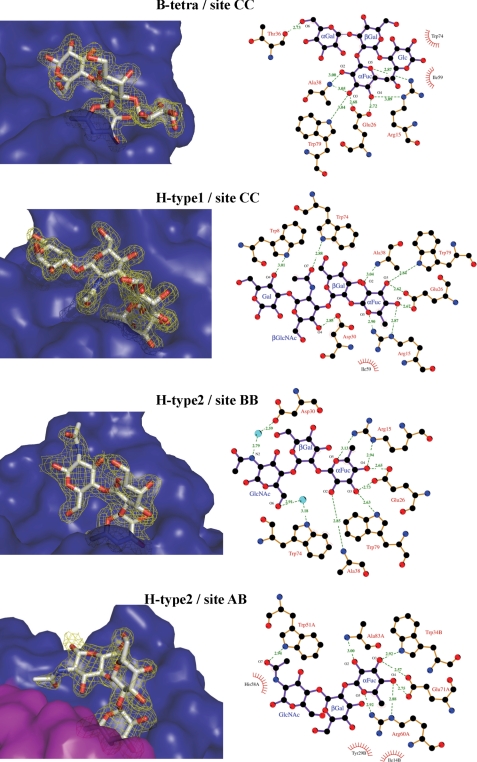
FIGURE 4.
Binding of fucosylated oligosaccharides by BambL. 2mFo − DFc electron density maps contoured at 1σ are represented in the left-hand panels. The solvent-accessible surface of the protein is shown in blue for one monomer and magenta for the other. Interactions between BambL and oligosaccharides are represented in the right-hand panels with details of hydrogen bond distances. Two-dimensional plots, created using LIGPLOT, display all of the amino acids interacting with oligosaccharides and bridging water molecules with details of hydrogen bond distances.

