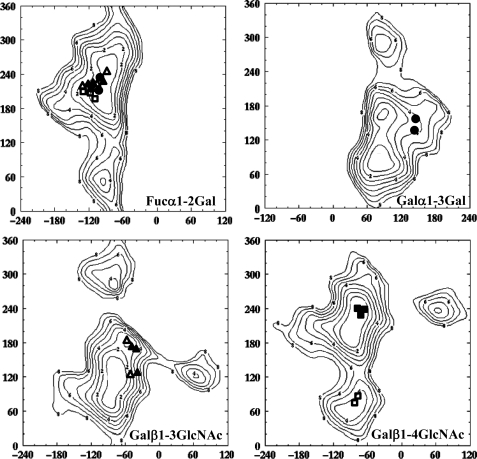
FIGURE 5.
Conformations of glycosidic linkages of bound oligosaccharides reported on the corresponding MM3 energy maps available at the Glyco3D site. H-type 1 oligosaccharide conformations are represented by triangles, H-type 2 by squares, and B-tetra by circles. Filled and open symbols are for oligosaccharides in the intra- and intermolecular sites, respectively.

