FIGURE 6.
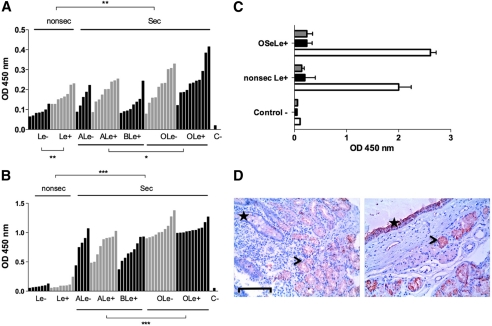
Binding of labeled BambL and UEA-I to human saliva and tissues. A, saliva samples were collected from 59 healthy individuals of known ABO, secretor, and Lewis phenotypes. Each bar represents binding of BambL at 0.1 μg/ml to an individual saliva sample as the mean OD values of duplicates. Samples are grouped by their histo-blood type and ranked by OD values within each subgroup. The negative control value in the absence of saliva (BSA only) is depicted by C−. Comparisons between subgroups were performed using a two-tailed Mann-Whitney test (*, p < 0.02; **, p < 0.01). B, binding of UEA-I at 1 μg/ml to individual saliva samples as presented above. Comparisons between subgroups were performed using a two-tailed Mann-Whitney test (***, p < 0.0001). C, inhibition of BambL binding to saliva from either O secretor Lewis positive (OSeLe+) or nonsecretor Lewis positive (nonsec Le+) saliva samples by 100 mm fucose (black bars) or 5 mm 2′-fucosyllactose (gray bars). OD values in the absence of inhibitor are shown with white bars. Values represent mean values ± S.D. of two samples in duplicate. Control − denotes negative control value in the absence of saliva. D, staining by biotinylated BambL of tissue sections from the duodenum of a nonsecretor Lewis positive individual (left) and the trachea from an O secretor Lewis positive donor (right). Bar = 100 μm. The specific staining appears in red and hematoxylin counterstaining in blue. On the left panel, the location of the crypts of Lieberkühn with unstained goblet cells is shown by a star, and the location of the stained Brünner glands is shown by an arrowhead. On the right panel, the surface epithelium of the trachea is shown by a star, and the arrowhead indicates the location of a stain-associated mucous gland.

