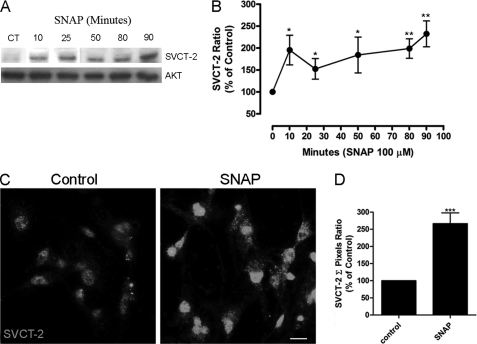
FIGURE 4.
Stimulation of SVCT-2 expression by NO. Cultures were incubated with SNAP (100 μm) for different time periods and then prepared for Western blotting (A). Data were quantified using ImageJ software and plotted in a SVCT-2/AKT ratio normalized to the control (B). Cells were incubated with SNAP (100 μm) for 80 min and immunocytochemistry was performed (C). A histogram displaying the pixel intensity (D) relative to nitric oxide effect on SVCT-2 expression is also shown. Results in A and C are representative images. Data in B and D are the mean ± S.E.M. of different and independent experiments. For B: CT (n = 9), 10 min (n = 7), 30 min (n = 4), 50 min (n = 7), 80 min (n = 8), 90 min (n = 5); D: CT (n = 3), SNAP (n = 3). *, p < 0.05 (relative to control); **, p < 0.01 (relative to control); ***, p < 0.001 (relative to control). CT, control.

