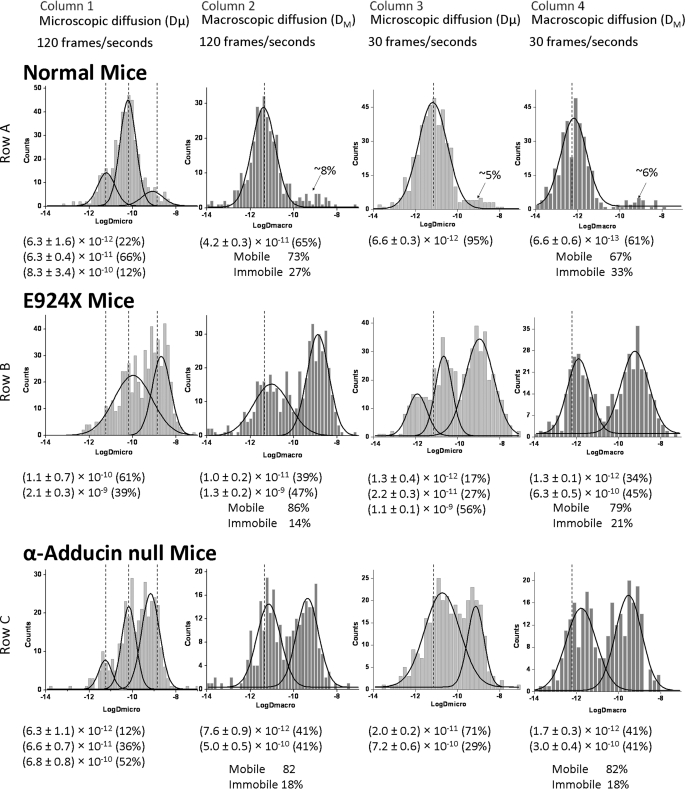
FIGURE 2.
Histogram plots of diffusion coefficients of labeled band 3 molecules in intact normal, ankyrin-null (E924X), and α-adducin-null erythrocyte membranes. Distributions of the logarithms of Dμ and DM were determined by analysis of individual trajectories of labeled band 3 molecules on intact normal, α-adducin-null, and ankyrin-null (E924X) erythrocytes at 120 fps (bin size of 0.15 on histograms) and 30 fps (bin size of 0.2 on histograms) (see “Experimental Procedures”). For comparison purposes, the dotted line shows the position of the middle of the distribution of each major Gaussian curve present in wild-type erythrocytes measured under the same conditions. Below each panel, the mean diffusion coefficient of each population is provided, along with the percent of the total band 3 present in that population. Although all molecules of band 3 appear mobile over short time spans (Dμ), a measurable fraction appears to be immobilized over long time spans (DM). This fraction is also listed below each histogram of DM values. The sizes of the adducin- and ankyrin-linked populations were calculated by subtracting the minor population of rapidly diffusing band 3 in normal erythrocytes (denoted with an arrow and quantitated as a percentage of total band 3; see row A) from the same fraction of rapidly diffusing band 3 in each mutant cell type.

