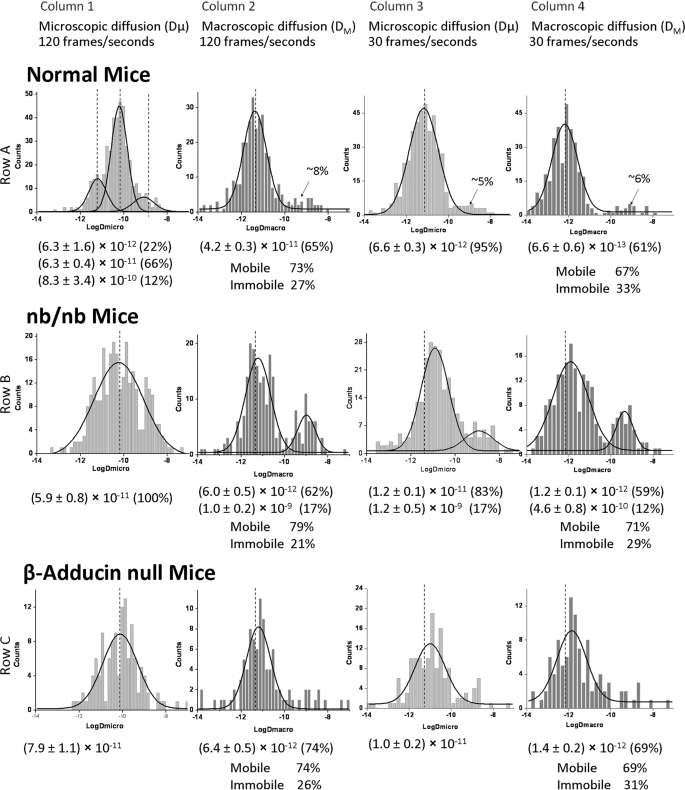
FIGURE 3.
Histogram plots of diffusion coefficients of labeled band 3 molecules in intact normal, partially ankyrin-deficient (nb/nb), and slightly adducin-deficient (β-adducin-null) erythrocyte membranes. All other details are similar to those provided in the legend to Fig. 2.

